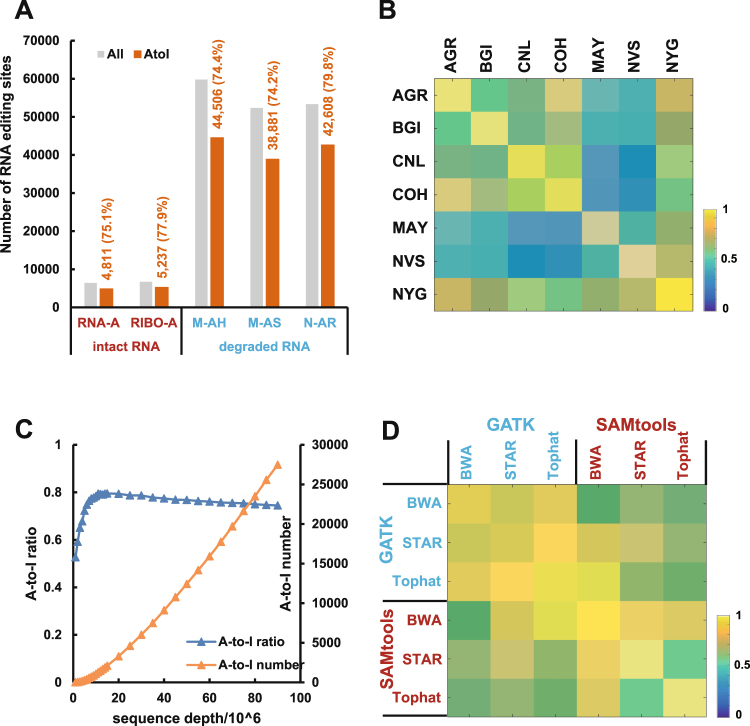
Figure 3.
Impact of multiple factors on the identification of RNA editing. (A) The number of RNA editing sites identified from intact RNA prepared by different library methods (poly-A-enriched or ribo-depleted) (left) and RNA degradation methods (heat, sonication or RNase-A) (right). The grey and orange bars represent the number of RNA editing sites and number of A-to-I editing sites, respectively. The number of predicted editing sites and A-to-I ratio are listed in orange. RNA-A: poly-A-enriched; RIBO-A: ribo-depleted; M-AH: heat; M-AS: sonication; N-AR: RNase-A. (B) The heatmap represents the reproducibility of RNA editing sites identified from different laboratories, including AGR (Australian Genome Research Facility), BGI (Beijing Genomics Institute), CNL (Weill Cornell Medical College), COH (City of Hope), MAY (Mayo Clinic), NVS (Novartis), and NYG (the New York Genome Center). (C) The relationship between the sequence depth (mapped reads) and the number of A-to-I editing sites (orange line) and the A-to-I ratio (blue line). The left Y-axis is the A-to-I ratio, whereas the right Y-axis is the number of A-to-I editing sites. Each point represents the average value of 10 repeated analyses at that sequence depth. (D) The heatmap represents the reproducibility of RNA editing sites for different read mapping methods (BWA, STAR, and Tophat) and variant calling methods (GATK and SAMtools).

