FIGURE 3.
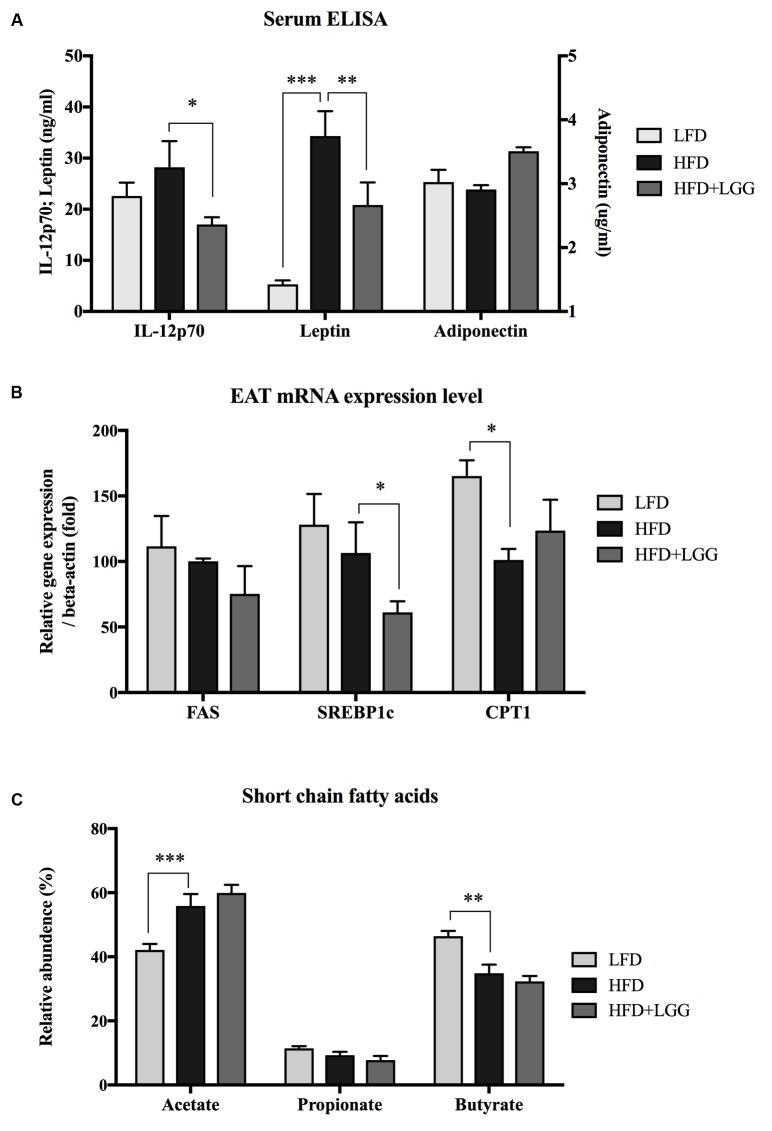
(A) Serum IL-12p70, leptin and adiponectin were measured using the ELISA method. (B) mRNA expression level of fatty acid synthase (FAS), sterol regulatory element-binding protein 1c (SREBP1c) and carnitine palmitoyltransferase 1 (CPT1) were measured from epididymal adipose tissue (EAT). (C) Short chain fatty acids from fecal samples of each group were measured by gas chromatography. Significance level was calculated by using ANOVA and Bonferroni’s multiple comparisons test; results are illustrated as ∗p < 0.05, ∗∗P < 0.01, ∗∗∗P < 0.001.

