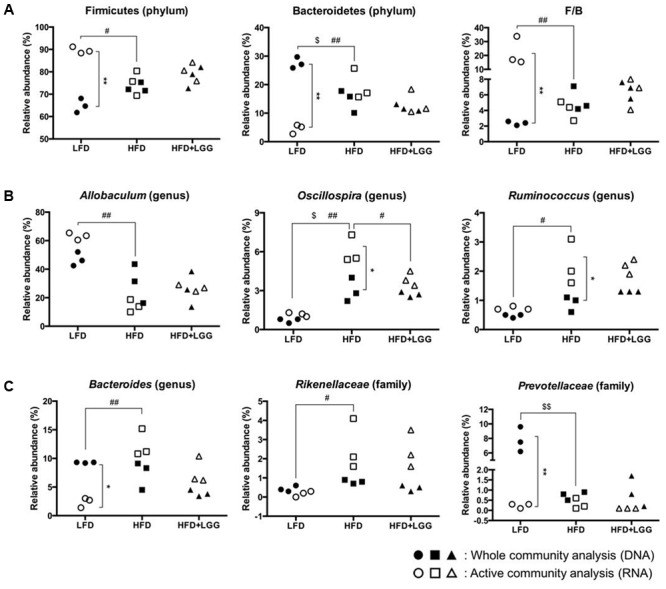
FIGURE 5.

Fecal microbiota of LFD, HFD, and HFD+LGG groups. Black colored circle, rectangle, and triangle illustrate results of DNA analysis while empty symbols illustrate results of RNA analysis. (A) Firmicutes, Bacteroidetes, and Firmicutes over Bacteroidetes ratio (F/B); (B) major sub-groups of Firmicutes; (C) major sub-groups of Bacteroidetes. Significance level was calculated using ANOVA and Bonferroni’s multiple comparisons test and ∗ shows significant difference between DNA and RNA analysis, $ shows significant difference of LFD and HFD+LGG compared to HFD according to DNA analysis and # shows significant difference of LFD and HFD+LGG compared to HFD according to RNA analysis. The level of significance is expressed by the number of symbols (one = <0.05, two = <0.01, three = <0.001).
