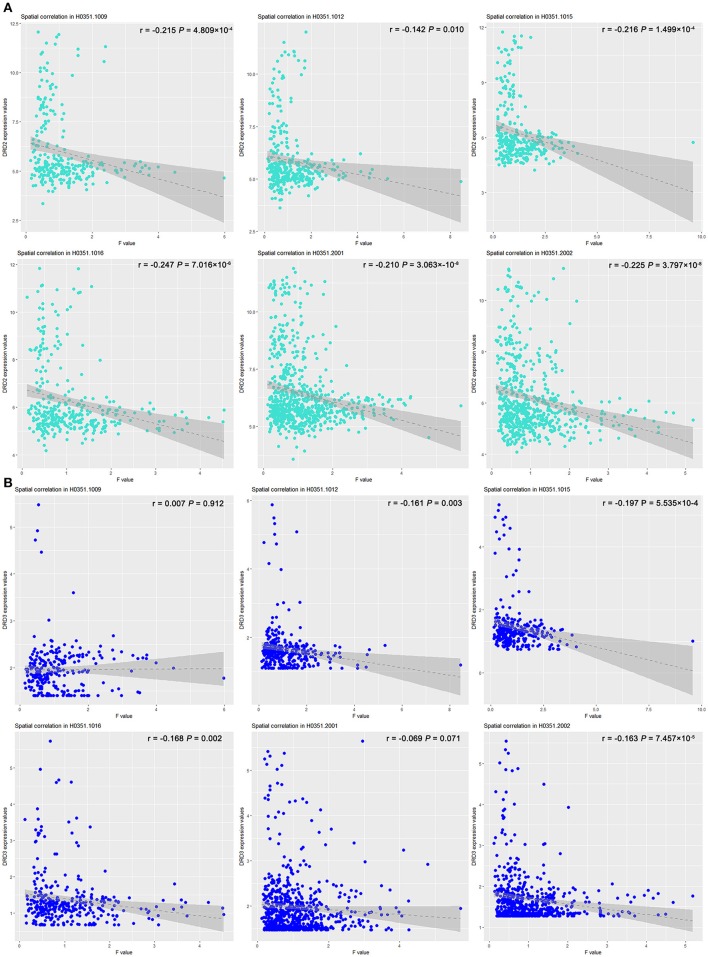
Figure 4.
Scatter plots of spatial correlation between statistical map derived from group difference of lrFCD and two dopamine receptor genes. Scatter plots depict relations between expression values of (A) DRD2 and (B) DRD3 genes (y axis) and F-statistic value (x axis) corresponding to COMT rs4633 genotypic effect on lrFCD. COMT, catechol-O-methyltransferase; lrFCD, long range functional connectivity density.

