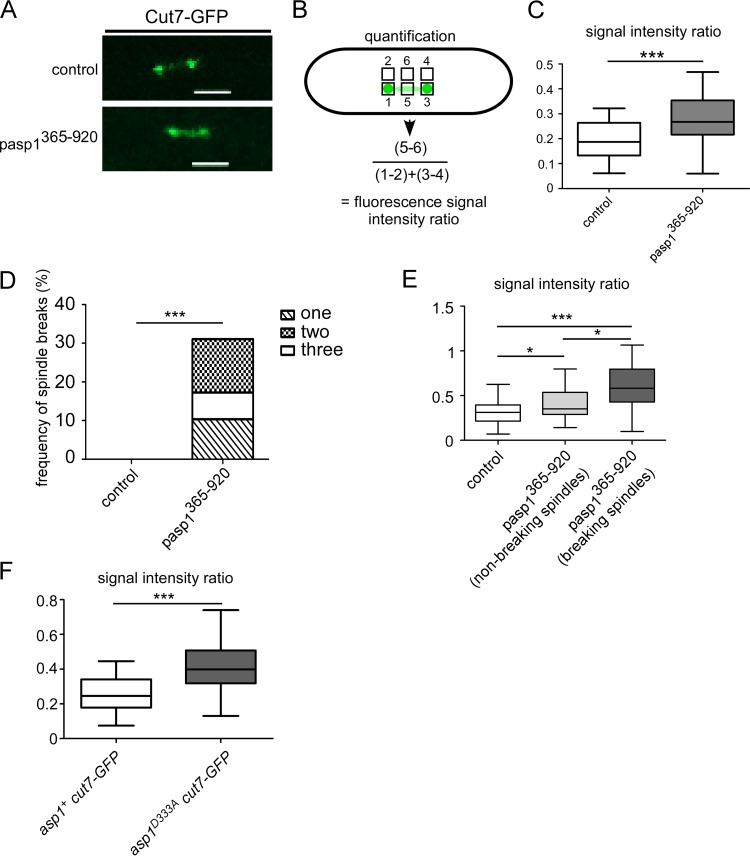
FIG 4.
IP8 controls Cut7-GFP spindle association. (A) Photomicrographs of cut7+-GFP cells transformed with a vector control or an asp1365–920-expressing plasmid. Scale bars, 2 μm. (B) Quantification of the fluorescence signal of Cut7-GFP on short spindles. For comparison of the signal intensity at the spindle midzone to that at the spindle ends, the fluorescence signal at the midzone was normalized against the background (square 5 − square 6) and divided by the fluorescence intensity at spindle ends (square 1 − square 2 plus square 3 − square 4). (C) Diagrammatic representation of the ratio of the spindle midzone/spindle ends (control, n = 29; pasp1365–920 strain, n = 24; ***, P ≤ 0.001, t test; significant outliers were removed using Grubbs' test). (D) Diagrammatic representation of the frequency of spindle breaks in the indicated transformants (control, n = 30; pasp1365–920 strain, n = 29; ***, P ≤ 0.001, χ2 test). (E) Diagrammatic representation of the ratios of the spindle midzone/spindle ends (control, n = 30; pasp1365–920 strain [nonbreaking spindles], n = 23; pasp1365–920 strain [breaking spindles], n = 17 [9 cells]; *, P ≤ 0.05; ***, P ≤ 0.001, t test). (F) Diagrammatic representation of the ratios spindle midzone/spindle ends (asp1+ cut7-GFP strain, n = 29; asp1D333A cut7-GFP strain, n = 24; ***, P ≤ 0.001, t test; significant outliers were removed using Grubbs' test). Analysis was carried out at 33°C.

