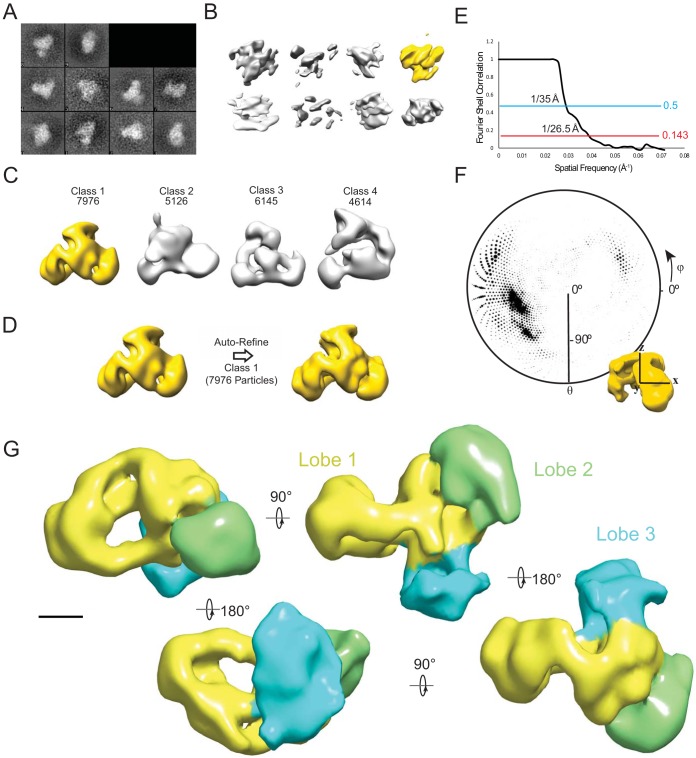
FIG 2.
3D reconstruction of the yeast NuA4 complex. (A) 2D class averages of the 256 untilted particles from tilt pairs used to generate initial random conical tilt (RCT) reconstructions. (B) RCT reconstructions generated from particles gathered at 40°/0° tilt angles. The highlighted model was used for further reconstruction. (C) 3D classification results using the RCT model as a starting model with the number of particles sorted to each class. The highlighted model was used for further refinement. (D) Autorefinement of the most populated 3D model using particles that were classified to class 1 in the 3D classification step. (E) Gold-standard Fourier shell correlation curve indicating the resolution of the model. (F) Angular distribution representation of the input particles to the final model represented as a polar plot. θ and φ correspond to the rotation about the y and z axes, respectively. The radius of the plotted circles represents the number of particles in a particular orientation. (G) 3D reconstruction of NuA4. Different lobes are indicated by color. Scale bar, 50 Å.

