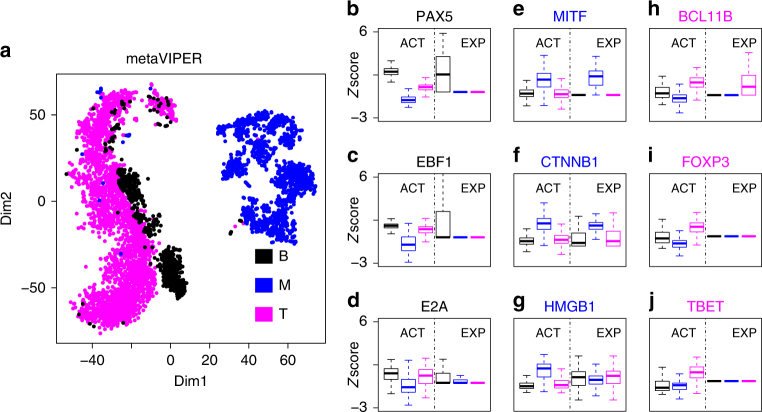
Fig. 3.
Inference of protein activity for single cells profiled by Tirosh et al.35. a Annotated cell types (B: B lymphocyte, T: T lymphocyte, M: melanoma cell) were separated by t-SNE analysis, using metaVIPER-inferred activity for all annotated transcriptional factors, co-transcriptional factors, and signaling proteins. Boxplots show metaVIPER-inferred activity, as well as gene expression for tissue-specific lineage markers, including PAX537, EBF138, and E2A39 for B lymphocyte (b–d), MITF40, CTNNB141, and HMGB142 for melanocyte (e–g), BCL11B43, FOXP344, and TBET45 for T lymphocyte (h–j). While these markers are significantly differentially active in these tissues, they could not be effectively assessed at the single cell level, either because no mRNA reads were detected or because markers were not statistically significant in terms of differential gene expression. Boxplots showed the median, lower/upper whiskers, and hinges of z-scores

