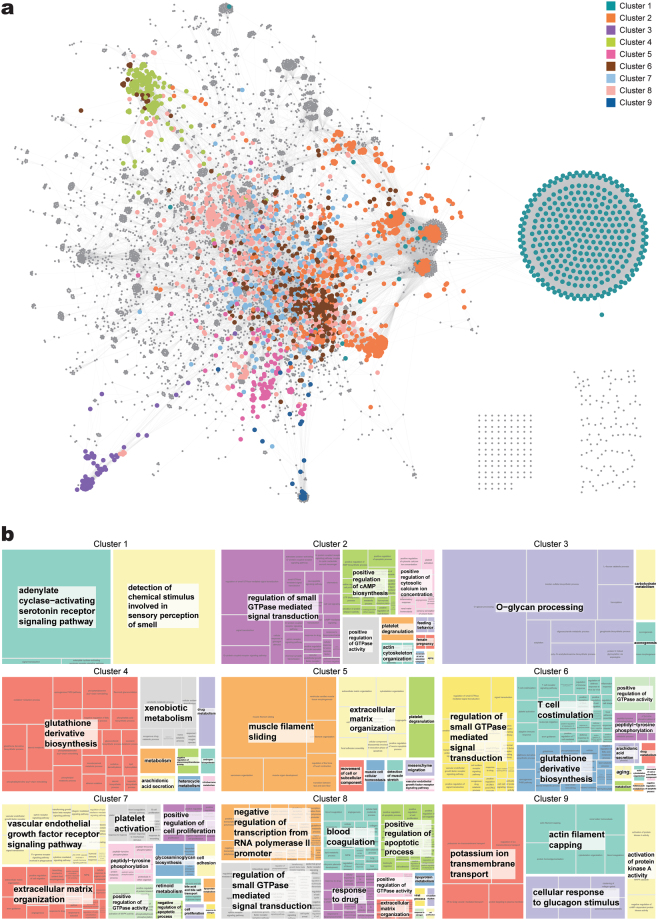
Figure 4.
Gene clustering of single-depth PPI network of pcPSGs and gene ontology (GO) term summarisation of gene clusters. (a) Gene clusters of nine subnetworks are shown in different colours. The colour indicator is located in the top right corner. The genes that are not in subnetworks are grey colour. (b) GO term summary of gene clusters of subnetworks are presented as a tree map. The name of the subnetwork is on top of the tree map, and the relative size of blocks shows the significance of enrichment of the GO term. Similar GO terms were combined and grouped into a large block of the same colour. The term of most uniqueness in the large block is shown on the white box and located at the centre of the block.

