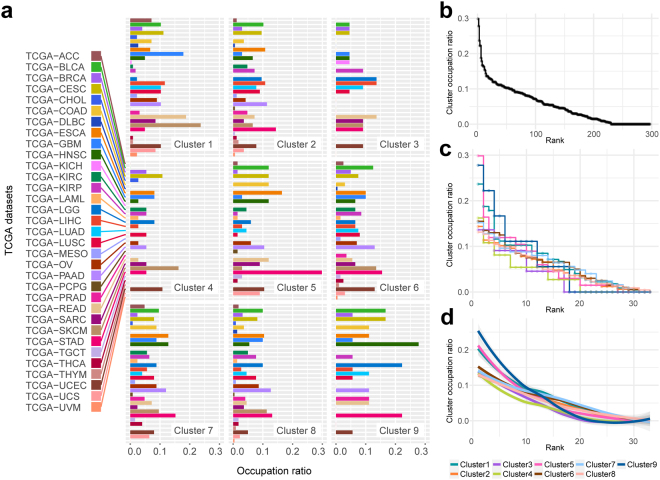
Figure 6.
Level of cluster occupation of TCGA datasets in subnetworks and distribution of cluster occupation ratios. (a) Occupation ratio of TCGA dataset is shown for each cluster. The length of bar indicates occupation ratio of the dataset that takes the number of shared genes into account. (b) For all occupation ratio of (a), the ratio against their rank is shown. (c) A stair-step plot shows the occupation ratio against the rank for each cluster. (d) The smoothing plot using loess regression of (c). The indicator of colours for clusters is on the bottom right corner.

