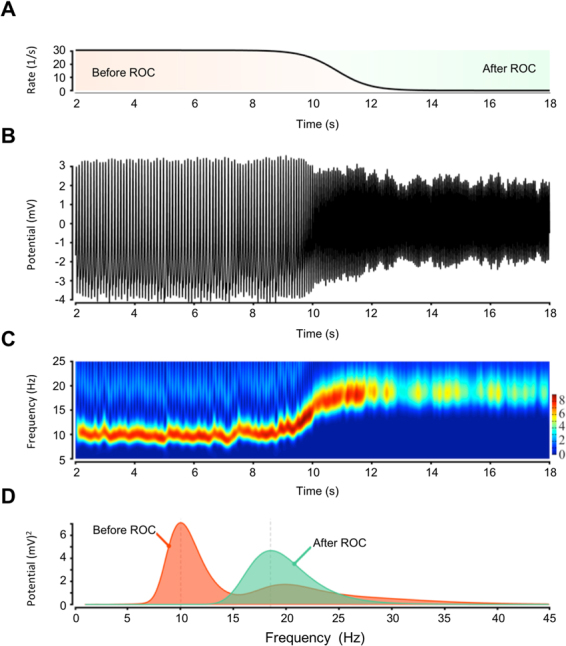
Figure 8.

Result of Jansen et Rit Model of cortex under inhibition: Frequency increases with decreasing inhibition (in the model) during the recovery of consciousness (ROC). (A) Decrease in the inhibition tone. (B–D) The dominant rhythmic activity from the alpha into the beta band. (A) The inhibitory interneurons are excited before ROC and are recovering back to normal after the ROC. The mean postsynaptic potential of the pyramidal cells is shown in B and is transformed in the time-frequency domain in C. The frequency spectrum before and after ROC is shown in D.
