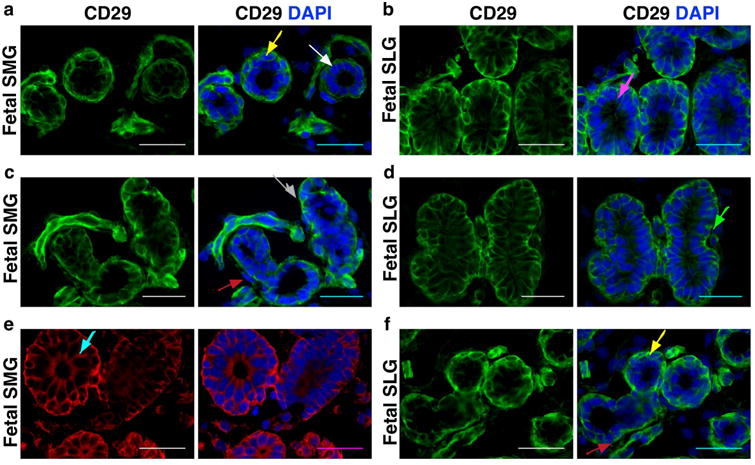
Figure 2.

(a-f) In situ co-localization of CD29 in human fetal sublingual and submandibular glands. Different colored arrows indicate as follows: White=serous acini; Magenta=mucous; Gray=serous demilunes; Green=intercalated ducts; Blue=excretory ducts; Yellow=myoepithelial cells; Red=mesenchymal cells. Nuclei was stained in DAPI (blue). All scale bars represent 50 μM.
