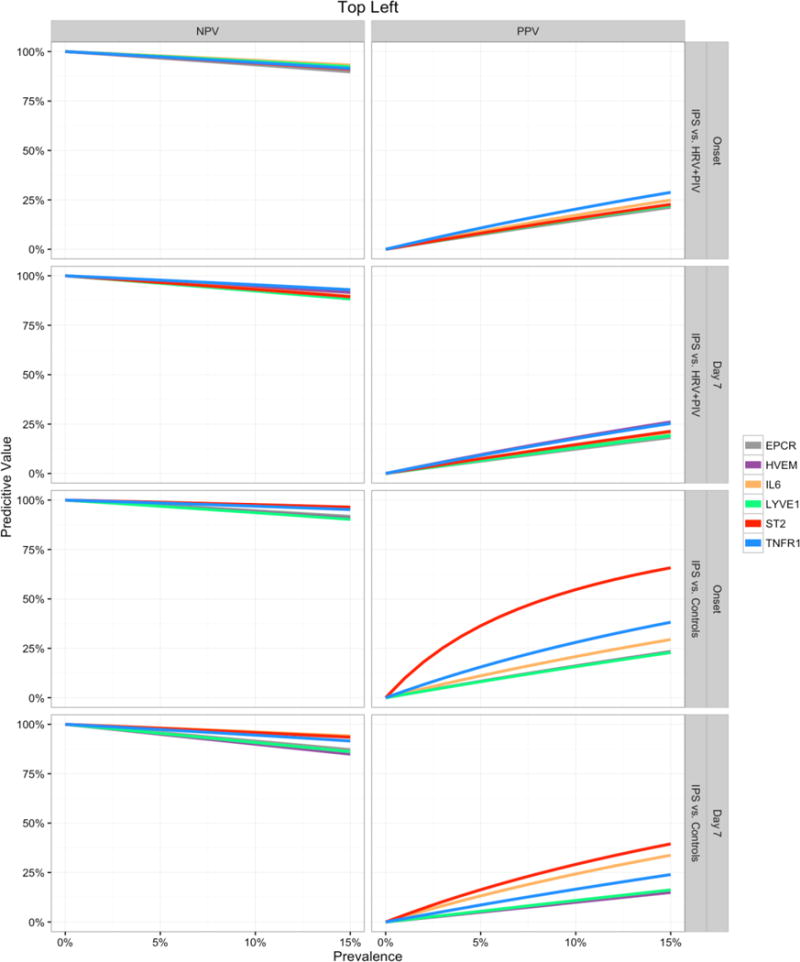
Figure 4. Prognostic values by prevalence of IPS.

Negative Predictive Value (NPV, left panels) and Positive Predictive Value (PPV, right panels) curves for each biomarker are shown for predicting IPS at the day of onset or day 7 after HCT. Predictive values were calculated using the sensitivity and specificity values from the points closest to the top left corner of the ROC curves and are estimated for a range of hypothetical IPS prevalence values (x-axis).
Abbreviations: IPS, idiopathic pneumonia syndrome; HCT, hematopoietic cell transplantation; ROC, receiver operating characteristic; HRV, human rhinovirus; PIV, parainfluenza virus; EPCR, endothelial protein C receptor; HVEM, herpes virus entry mediator; IL-6, interleukin-6; LYVE1, lymphocyte vessel endothelial receptor; ST2, Stimulation 2; TNFR1, tumor necrosis factor receptor 1.
