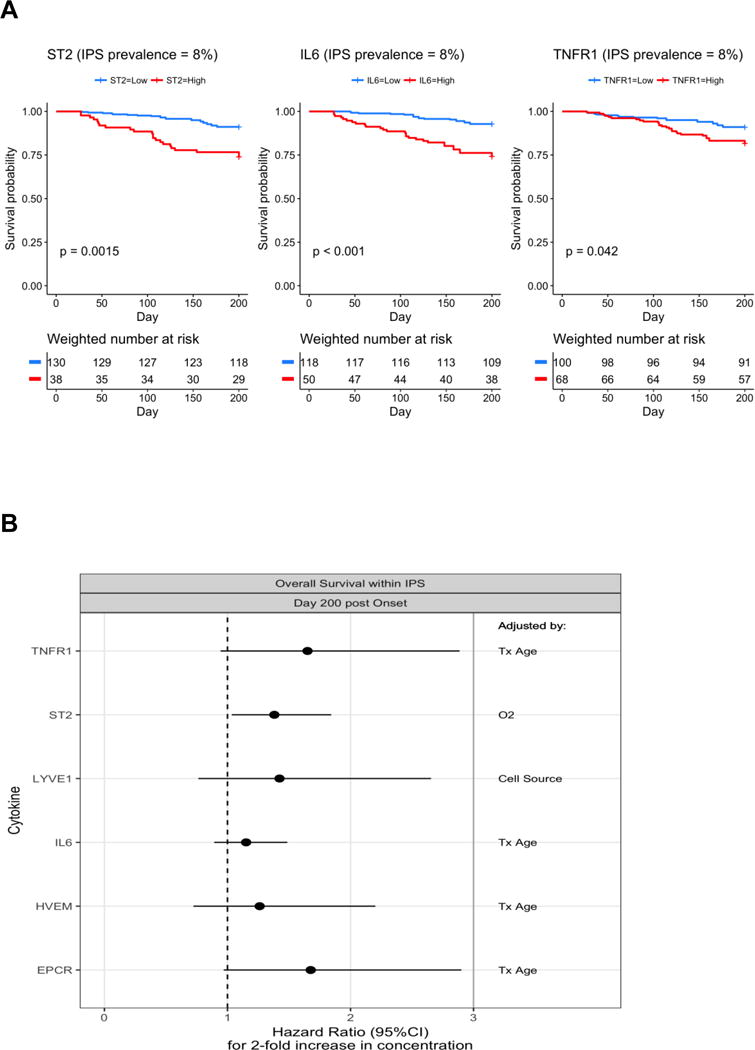
Figure 5. Overall survival according to each biomarker.

(A) Weighted Kaplan-Meier survival curves were estimated among IPS cases and controls reweighting IPS cases so that prevalence of IPS is represented as 8%. P-values resulted from similarly weighted log-rank tests. The cutoff values for dichotomizing the marker values come from the ROC analysis comparing IPS and controls at day 7 post-HCT, and are 21 ng/mL in ST2, 61 pg/mL in IL-6, and 3421 pg/mL in TNFR1. Numbers at risk are estimated from weights (below x-axis). (B) Forest plots show the associations between each analyte’s onset value and day 200 post-infection survival among the IPS cases. A multivariable model for each analyte was constructed in a step up fashion by adding one clinical variable to the model that modified the association of the analyte with the outcome by more than 10%. The final adjustment factor included in each model is shown in the right column.
Abbreviations: IPS, idiopathic pneumonia syndrome; ROC, receiver operating characteristic; HCT, hematopoietic cell transplantation; ST2, Stimulation 2; IL-6, interleukin-6; TNFR1, tumor necrosis factor receptor 1; LYVE1, lymphocyte vessel endothelial receptor; HVEM, herpes virus entry mediator; EPCR, endothelial protein C receptor; Tx, transplant; O2, oxygen requirement at the time of sampling.
