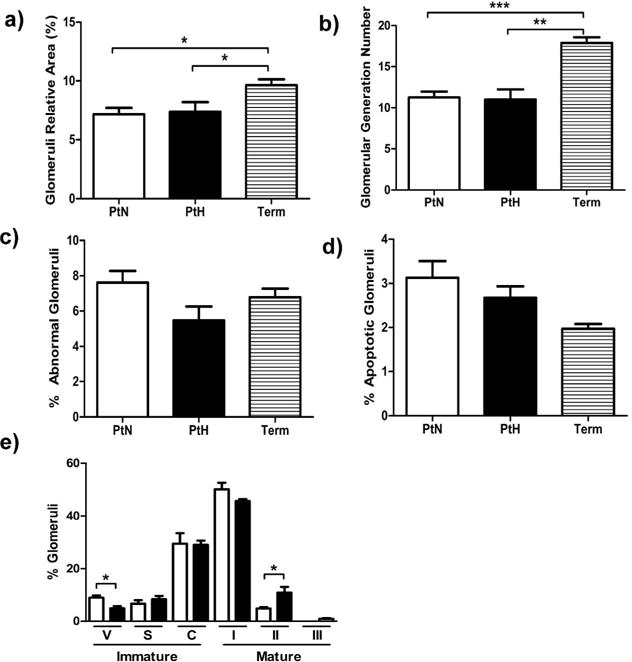
Figure 5. Glomeruli Assessment.

(a) Relative area of glomeruli, (b) estimated glomerular generation number, (c) percentage of mature glomeruli with an abnormal appearance, (d) and percentage of apoptotic glomeruli are shown. (e) Stages of glomerular development in PtH (black bar) and PtN (white bar) kidneys are shown [Immature stages: Vesicular Stage (V), S-Shaped or Comma-Shaped (S), Capillary loop stage (C); Mature Stages: Stage I (I), Stage II (II), Stage III (III)]. Error bars represent standard deviation (***, P<0.001; **, P<0.01; *, P<0.05).
