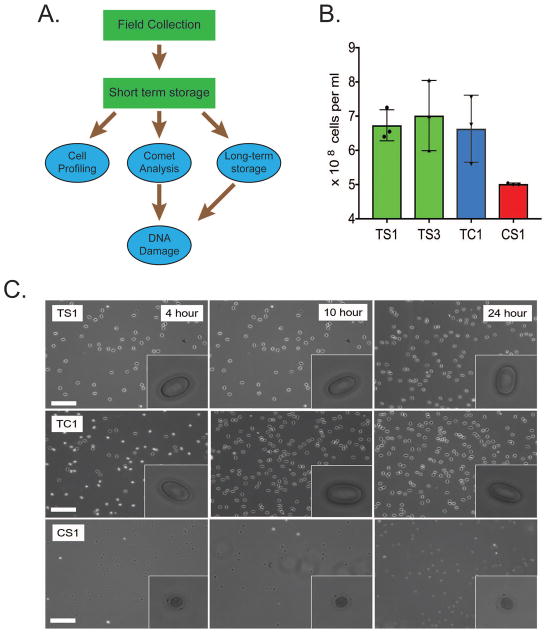
Figure 2. Determination of CometChip suitability for field-based research.
(A) Plan for the collection and utilization of blood samples collected in the field. Steps in green are conducted in the field, the steps in blue are conducted in the laboratory. (B) Cell counts were taken from each of the four turtles: T. scripta (TS), T. carolina (TC) and C. serpentina (CS). All turtle species had a high cell count. Each count was measured in triplicate. (C) Morphology of erythrocytes from the different turtle species. Magnified image of the cells after 4, 10 and 24 hours on ice. Storage on ice did not visibly effect cellular morphology. Erythrocytes from the CS animal had a distinct morphology compared to TS and TC cells. Scale bar represents 200 μm. Inserted box is 20 μm.

