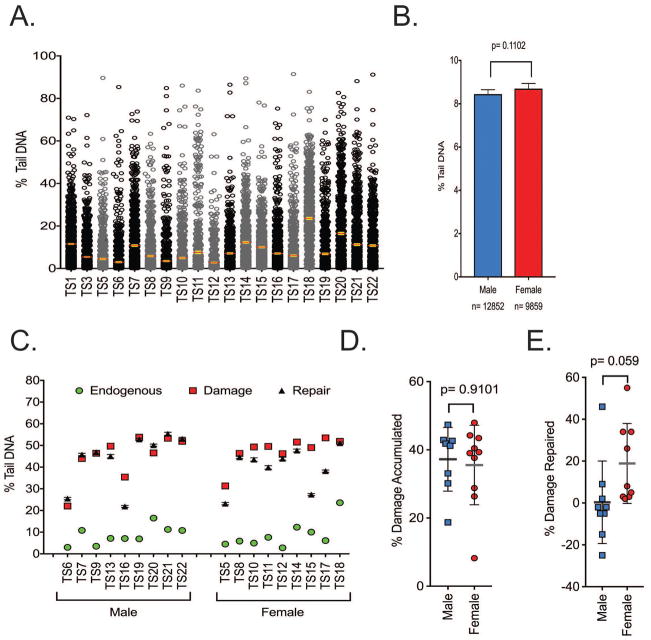
Figure 5. DNA damage analysis in cells from T. scripta.
(A) Spread of endogenous DNA damage in the cohort. All data points are shown. Error bars are mean ± 95% confidence interval. Female animals are represented in grey, males represented in black. (B) Female animals trended towards having a higher endogenous level of DNA damage, n= 9859–12852 comets analyzed. (C) Samples were exposed to H2O2 and DNA damage measured immediately and after 30 minutes of repair. (D) The amount of DNA damage accumulated was normalized by subtracting the level of endogenous damage. There were no sex-linked differences in damage accumulation. (E) The % of DNA damage that was repaired was also compared. The amount of repaired substrate was also normalized by subtracting the level of endogenous damage. Both sexes repaired the induced DNA damage poorly. (Male n=9, Female n=9). All experiments were technical duplicates using un-frozen samples. Error bars represent mean ± SD.

