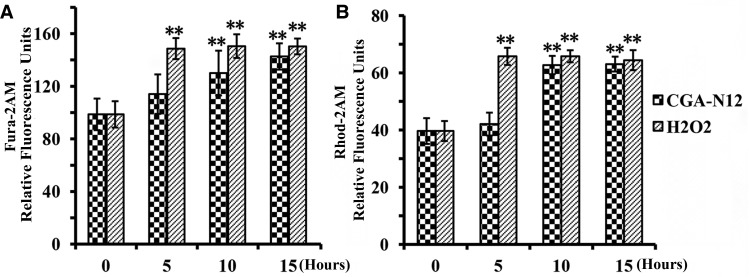
Figure 5. Detection of the effect of CGA-N12 on mitochondrial calcium ion influx.
Approximately 1 × 10⁶ C. tropicalis cells were incubated with 75 µM CGA-N12 at 28°C for 0, 5, 10, and 15 h. The fluorescence intensity of cytosolic and mitochondrial Ca2+ levels was assessed using Fura-2-AM (Ex/Em = 340 nm/510 nm) and Rhod-2-AM (Ex/Em = 550 nm/580 nm), respectively. Relative levels of (A) cytoplasmic calcium ion and (B) mitochondrial calcium ion. Data represent the mean ± standard deviation for three independent experiments. Statistical significance was determined by Student's t-test. ** indicates statistical significant difference (P-values <0.01).

