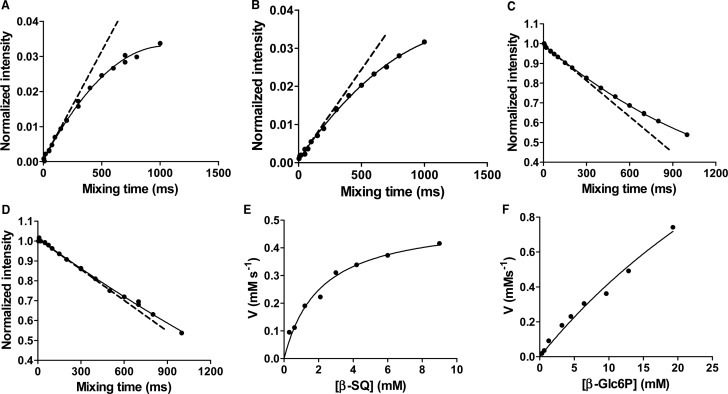
Figure 5. Kinetic analysis of HsSQM by inversion recovery 1D 1H EXSY.
Inversion recovery curves for 10 mM SQ or Glc-6-P corresponding to (A) α-SQ at 4.00 mM and (B) α-Glc-6-P at 3.57 mM. Inversion decay curves corresponding to (C) β-SQ at 6.00 mM and (D) β-Glc-6-P at 6.43 mM. Michaelis–Menten plots for (E) β-SQ and (F) β-Glc-6-P. Dashed lines indicate tangents to the fitted curve at t = 0.

