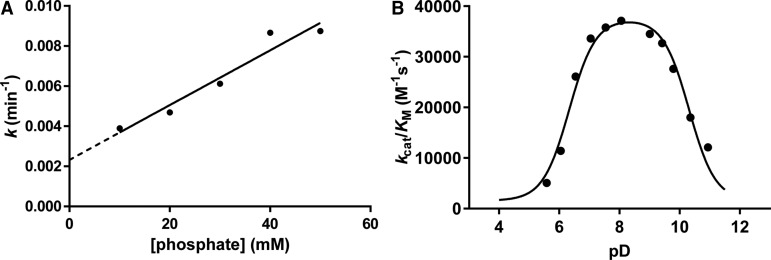
Figure 6. Spontaneous mutarotation of α-SQ and pD dependence of HsSQM.
(A) Plot of rates of spontaneous mutarotation of α-SQ versus phosphate buffer concentration at pseudo-constant ionic strength. Buffers consisted of 10–50 mM sodium phosphate and 2 M NaCl in D2O (pD 7.5). For comparison, k = 0.0073 min−1 in 50 mM sodium phosphate and 150 mM NaCl in D2O (pD 7.5). (B) pD dependence of HsSQM activity for mutarotation of Glc-6-P. Data were fit to a bell-shaped curve leading to estimated pKa values of 5.9 ± 0.1 and 9.9 ± 0.1.

