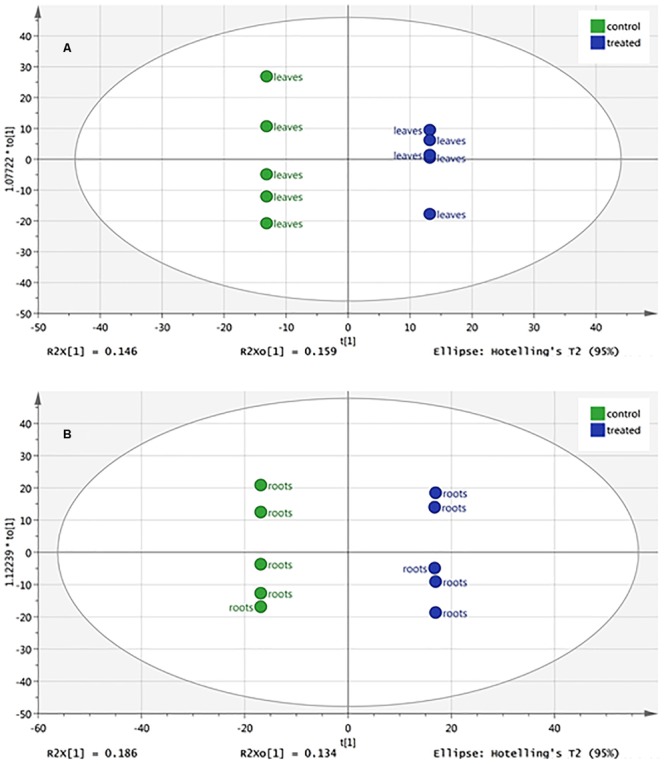
FIGURE 3.

Orthogonal Projections to Latent Structures Discriminant Analysis (OPLS-DA) of melon leaf (A) and root (B) metabolomic profile following root application of 0 (control) or 0.24 mL plant-1 of the biopolymer-based biostimulant. Ellipses denote Hotelling’s T2 (95%).
