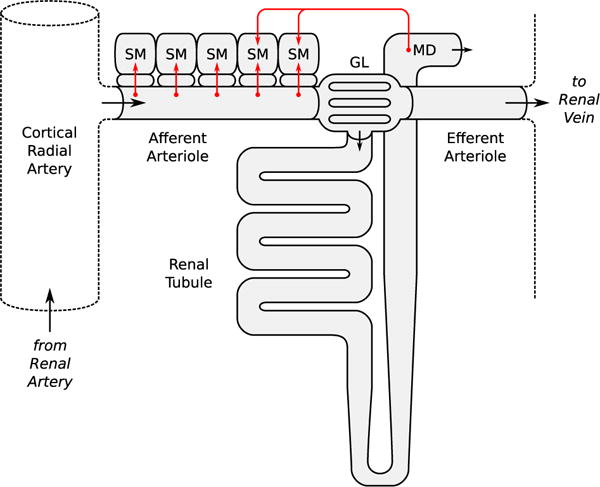
Fig. 1.

Schematic diagram of the nephrovascular unit represented in the full model. Arrows indicate fluid flow direction and sensor/effector sites of the autoregulatory mechanisms. SM smooth muscle layer, GL glomerulus, MD macula densa (Color figure online)
