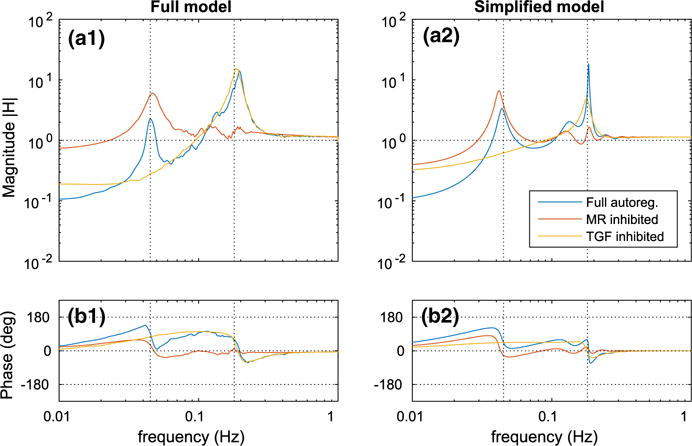
Fig. 11.

Transfer function H(f) evaluated with the autoregulatory mechanisms selectively inhibited. a1–b1 Full model. a2–b2 Simplified model. Vertical dotted lines indicate the baseline fundamental frequencies of spontaneous vasomotion (180 mHz) and TGF (45 mHz) (Color figure online)
