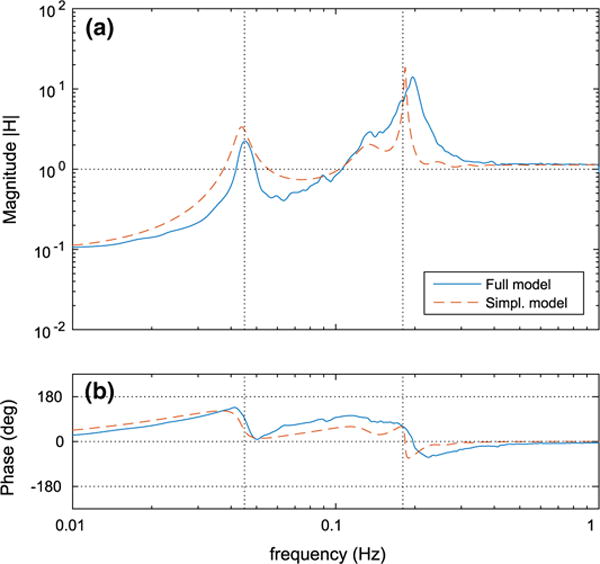
Fig. 7.

Transfer function H(f) evaluated using the full and the simplified models. a Transfer function magnitude |H(f)|. b Transfer function phase angle . Vertical dotted lines indicate the baseline fundamental frequencies of spontaneous vasomotion (180 mHz) and TGF (45 mHz) (Color figure online)
