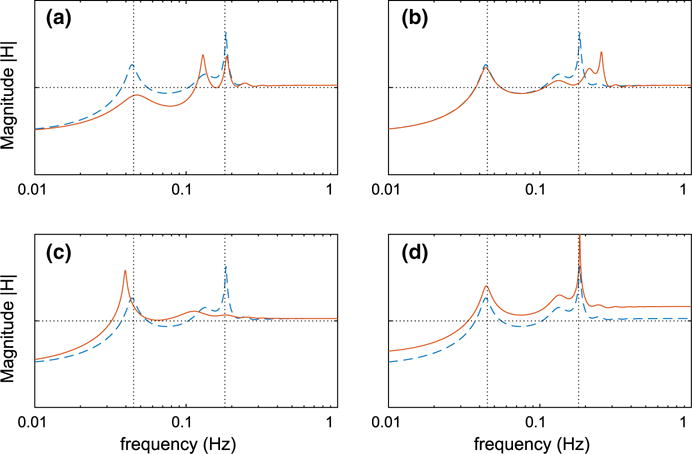
Fig. 9.

Effect of modifying selected components on transfer function magnitude. All panels show the transfer function of the simplified model with altered parameters (solid line) and baseline (dashed line). a Reduced tubular damping (cut off is at ~130 mHz while baseline is at ~100 mHz). b Natural frequency of spontaneous vasomotion (set to 250 mHz while baseline is 180 mHz). c Overdamping of smooth muscle oscillator (ηs = 2.5 while baseline ηs = 0.25). d Increased vascular compliance (10 times baseline). Vertical dotted lines indicate the baseline fundamental frequencies of spontaneous vasomotion (180 mHz) and TGF (45 mHz) (Color figure online)
