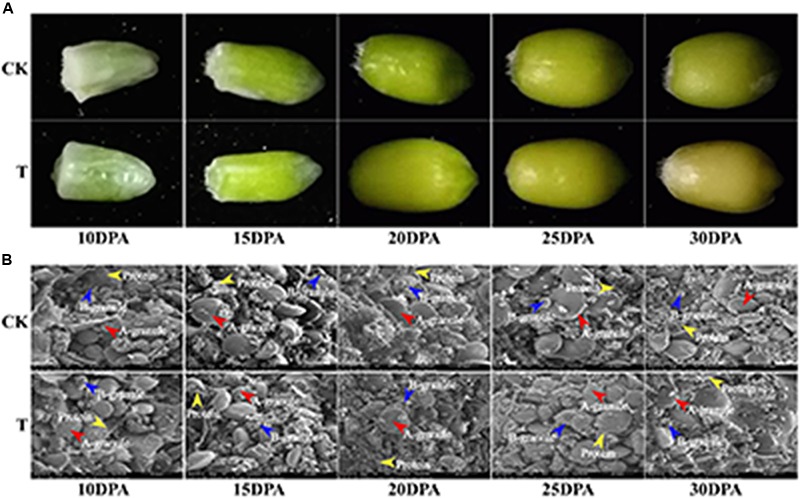
FIGURE 2.
Grain phenotype and ultrastructure changes under drought stress. (A) Grain phenotype changes at different developmental stages in both groups. (B) SEM images of developing grains from five periods in CK and drought treatment group. The scale bar is 20 μm. (A,B) Starch granules are marked with red and blue arrows, respectively, and the protein bodies are marked with yellow arrows.

