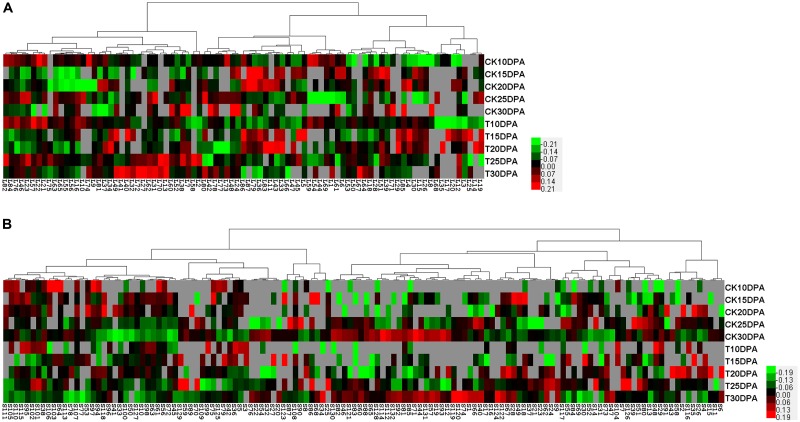
FIGURE 5.
Protein expression clustering analysis of DAP spots from 2-DE maps of flag leaves and developing grains. (A) Hierarchical clustering of DAP spots from flag leaves; (B) Hierarchical clustering of DAP spots from developing grains. Each column represents samples from control and drought treatment groups. Each row displays the change of a DAP spot using color-coding based on the relative ratio.

