FIGURE 5.

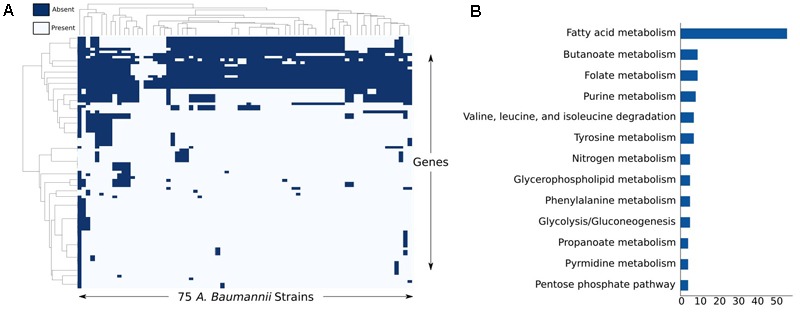
Analysis of least conserved genes. (A) Clustermap of the genes most deleted from each strain-specific model and (B) the corresponding subsystems of the reactions these genes code for.

Analysis of least conserved genes. (A) Clustermap of the genes most deleted from each strain-specific model and (B) the corresponding subsystems of the reactions these genes code for.