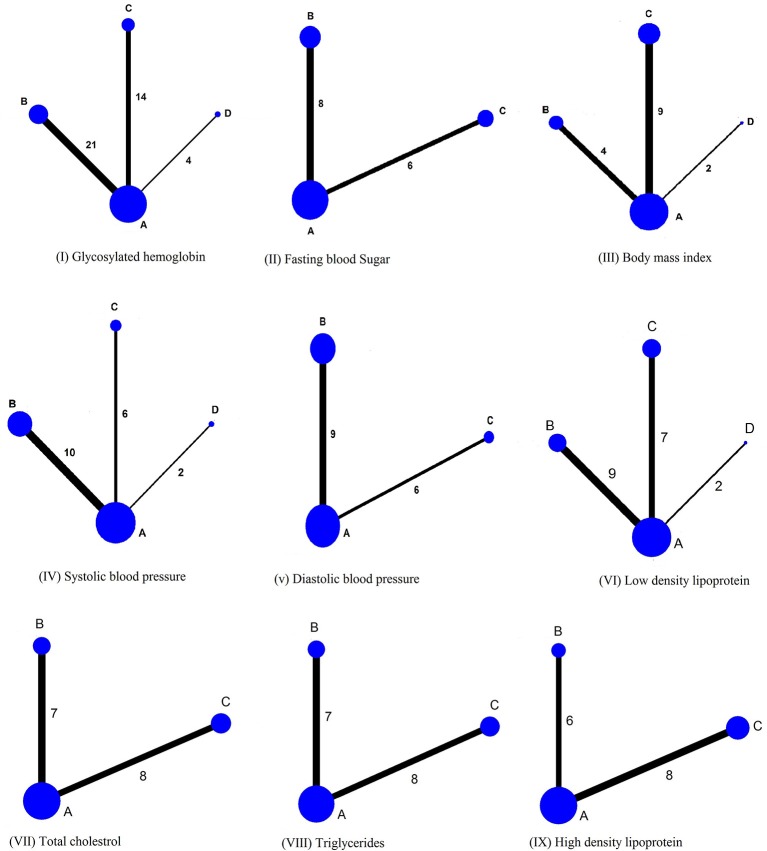
Figure 4.
Network plot. The width of lines for each connection in the evidence network is proportional to the number of randomized controlled studies that compared each point of treatment. The sizes of the nodes are proportional to the number of patients. A, Usual care; B, Pharmacist based diabetes education plus pharmaceutical care; C, Pharmacist based diabetes education; D, Diabetes education by health care team involving pharmacist as member.

