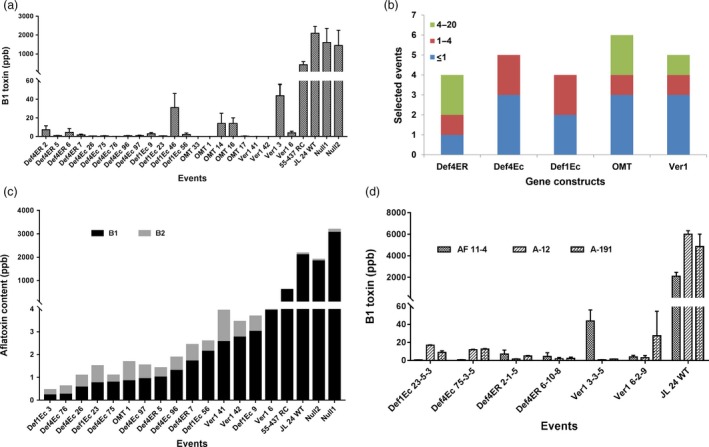
Figure 3.

Aflatoxin profile of T3 seed cotyledons of OE‐DEf and HIGS peanut lines following A. flavus infection at 72 h using HPLC (a) B1 levels (ppb) in the inoculated cotyledons of OE‐Def, HIGS and WT peanut lines. (b) Number of best homozygous events across five constructs that accumulate ≤20 ppb B1 toxin across 24 selected events. The colour codes reveal the range of B1 content based on HPLC. (c) Aflatoxin profiling based on individual toxin types in selected events of OE‐Def and HIGS lines accumulating <4 ppb B1 and B2 toxins after A. flavus (AF11‐4) infection. The events were sorted by the content. (d) Event‐wise comparison of B1 toxin (ppb) in a subset of homozygous T3 progenies of OE‐Def, HIGS and WT peanut lines against three different A. flavus morphotypes (AF11‐4, A‐12, A‐191).
