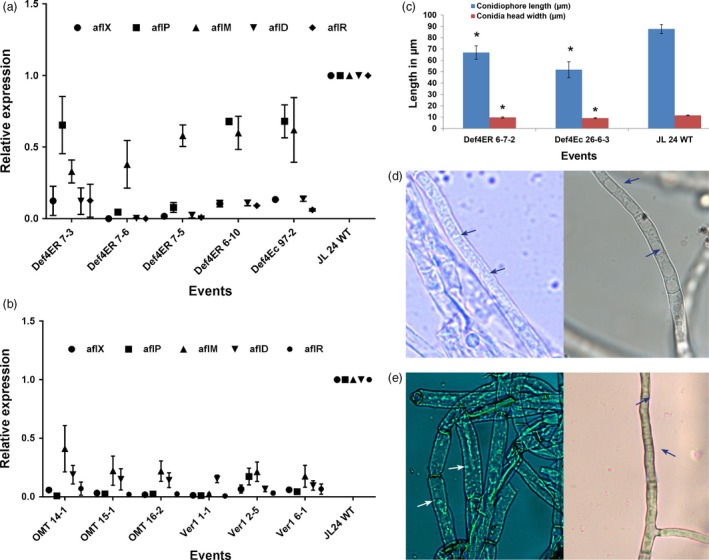
Figure 5.

Reduced expression of aflatoxin pathway genes in A. flavus and induced morphological alterations in infected transgenic/HIGS peanut lines. (a,b) Transcript abundance of fungal biosynthetic cluster genes in OE‐Def events (a) and (b) HIGS lines in comparison with the WT at 72 hpi. (c–e) Morphology of A. flavus (AF11‐4) infecting the OE‐Def, HIGS and WT peanut lines after 40 hpi. (c) Conidial morphology of OE‐Def events with WT. (d) Bright‐field microscopy of A. flavus at 40 hpi. Profuse vesicles (arrows) detected in the cytoplasm of fungus infecting the WT controls (left) compared to HIGS line OMT15‐1 (right; arrows indicate vacuoles) (magnification at 1000×). (e) High‐intensity staining of vesicles (arrows) reflects higher aflatoxin production ability in the A. flavus‐infecting WT (left) compared to HIGS line Ver1 6‐1 (right; arrows indicate vacuoles) (magnification at 1000×).
