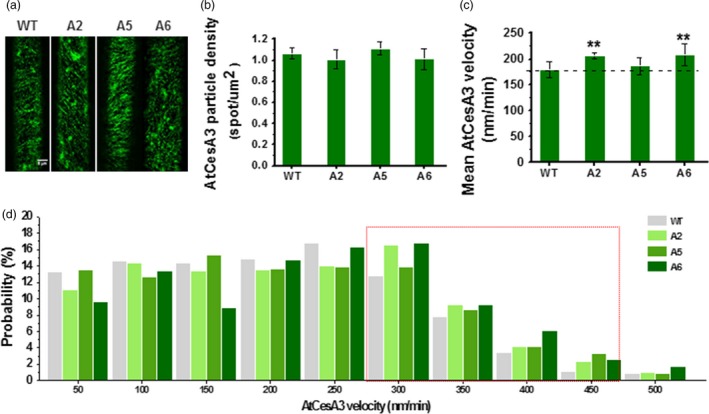
Figure 3.

Increased dynamic movements of primary wall GFP‐CesA3 at plasma membrane in the CesA6‐like overexpressing transgenic seedlings. (a) Schematic images of GFP‐CesA3 dynamic movements in epidermal cells of D3 hypocotyls. Scale bar, 5 μm. (b–d) Density of GFP‐CesA3 particles measured as foci/μm2 (b), GFP‐CesA3 mean velocity measured as nm/min (c) and velocity distribution of GFP‐CesA3 particles (d). Data indicated means ± SD; 578–1257 CesA3 particles were detected with n ≥ 4 cells from four different seedlings for each genotypes; **P < 0.01 by Student's t‐test.
