Figure 5.

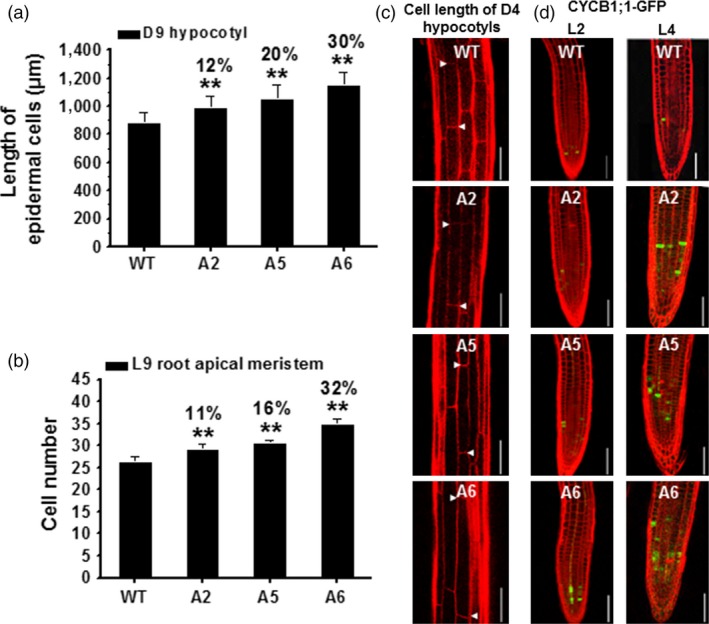
Enhanced cell elongation and division in three CesA6‐like overexpressing seedlings. (a, b) Measurement of basal longest epidermal cells of D9 hypocotyls (a) and cell number of L9 root apical meristem (b). Bars indicated means ± SD (n = 3 biological replicates), and at least 30 seedlings were measured for each replicate; **P < 0.01 by Student's t‐tests. (c) Confocal laser scanning microscopy images of basal longest epidermal cells of D4 hypocotyls using propidium iodide (PI) staining (red‐fluorescent). Arrowheads indicated a single cell; scale bars, 100 μm. (d) Typical expression of G2/M‐specific marker proAtCYCB1; 1::AtCYCB1; 1‐GFP (green) of plant cell cycle in the root apical meristem using PI staining (red‐fluorescent). Scale bars, 75 μm.
