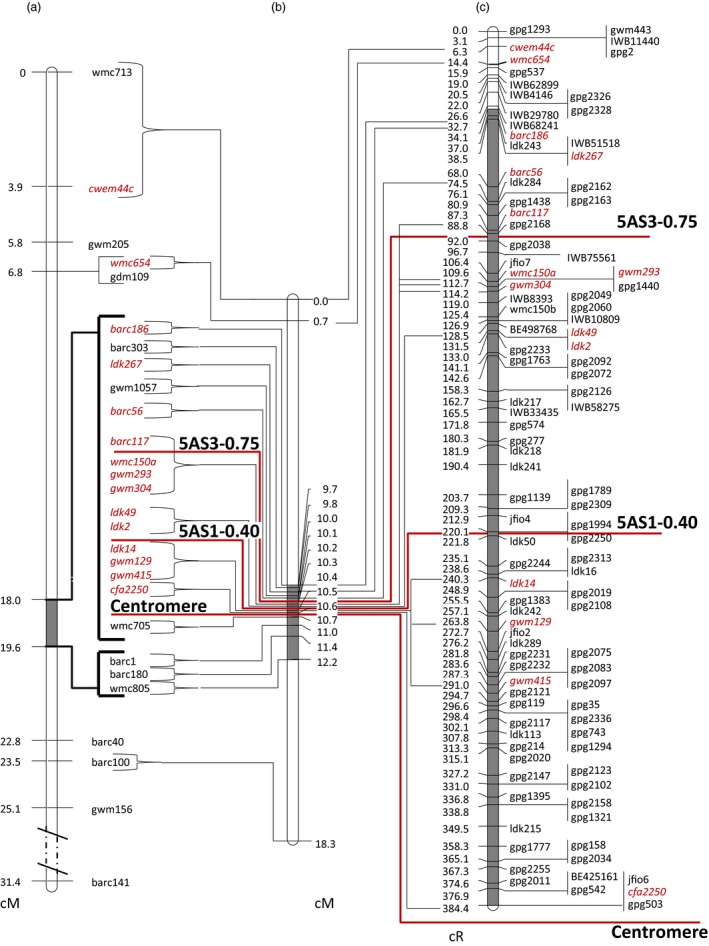
Figure 1.

Maps of the wheat chromosome 5AS. (a) Genetic map of the refined linkage group of the DH population (Buerstmayr et al., 2003); (b) genetic map of NI‐RIL population; (c) RSH‐consensus map. Markers included in all three maps are in red. Position of centromere and proximal borders of physical deletion bins are indicated by red solid lines. Highlighted grey intervals in chromosome bars refer to the Qfhs.ifa‐5A interval.
