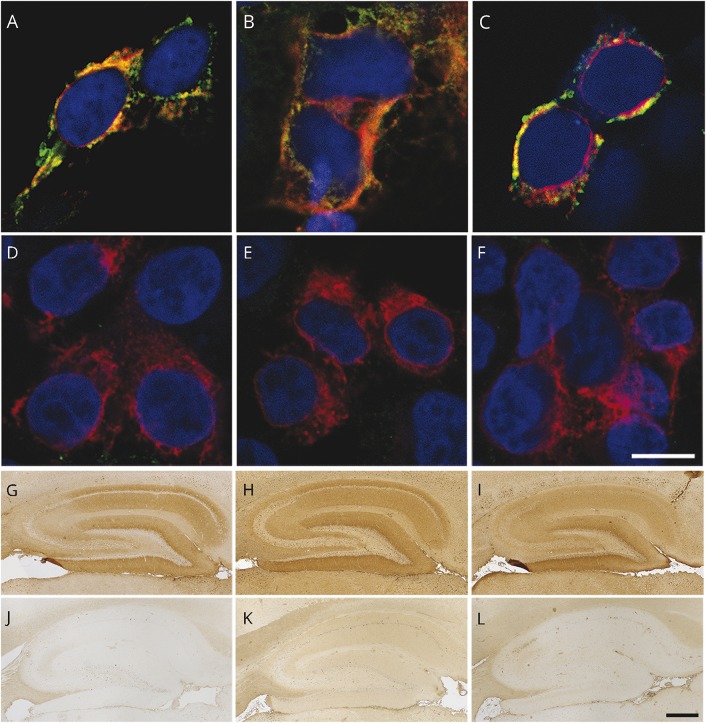
Figure 2. IgG, IgA, and IgM antibodies against the NMDAR demonstrated by CBA and brain tissue immunostaining.
CBA for NMDAR antibodies showing the reactivity of serum of 3 different patients with IgG (A), IgA (B), and IgM (C) antibodies. Patients' antibodies are shown with green fluorescence and a commercial antibody against a noncompeting NMDAR epitope with red fluorescence. (D–F) Lack of reactivity of a control sample (without NMDAR antibodies) using a similar CBA. (G–I) Brain reactivity of the 3 patients' samples (same as in A–C) using the corresponding secondary antibodies against IgG (G), IgA (H), and IgM (I). The lack of reactivity of the control sample using the indicated secondary antibodies is shown in panels J–L. In panels A–F, the cell nuclei are shown with DAPI; scale bar = 10 μm. In panels G–L, the slides have been mildly counterstained with hematoxylin; scale bar = 500 μm. CBA = cell-based assay; DAPI = 4′,6-diamidino-2-phenylindole; Ig = immunoglobulin; NMDAR = N-methyl-d-aspartate receptor.

