
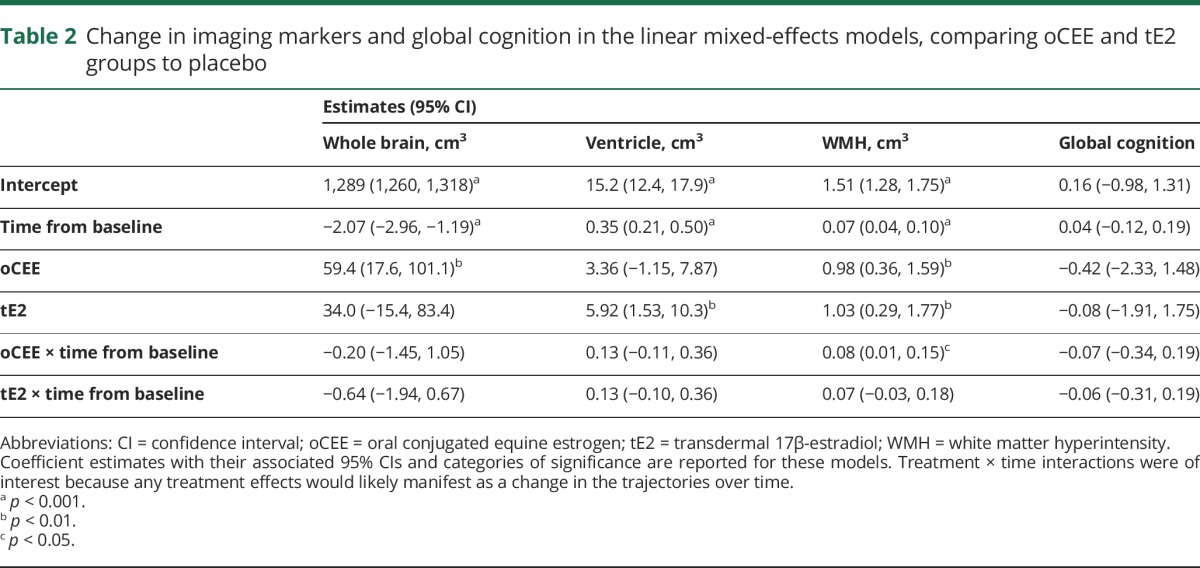
Table 2.
Change in imaging markers and global cognition in the linear mixed-effects models, comparing oCEE and tE2 groups to placebo
Official websites use .gov
A
.gov website belongs to an official
government organization in the United States.
Secure .gov websites use HTTPS
A lock (
) or https:// means you've safely
connected to the .gov website. Share sensitive
information only on official, secure websites.
Change in imaging markers and global cognition in the linear mixed-effects models, comparing oCEE and tE2 groups to placebo