Abstract
Paraquat (1,1′-dimethyl, 4,4′-bipyridinium dichloride; PQ), a widely used herbicide, is toxic to mammals through ingestion, inhalation and skin contact. Epidemiological data suggest that PQ is also mutagenic and carcinogenic, especially in high doses. The toxic and mutagenic properties of PQ are attributed to the ability of the molecule to redox-cycle, which generates reactive oxygen species (ROS) and subsequent oxidative stress. ROS also cause oxidative DNA damage such as 8-oxoguanine (8OG), a mutagenic base that, when replicated, causes G to T transversion mutations. The present study employed the CHO-derived cell line AS52 to quantify the mutagenic properties of low doses of PQ. By containing a functional, chromosomally-integrated copy of the bacterial gpt gene, AS52 cells a facile system for evaluating the mutagenic properties of genotoxicants. To bolster the sensitivity of this system for detecting mutagenesis of weak mutagens like PQ, and to provide a tool for mechanistic evaluation of the mutagenic process, we constructed a new AS52-derived cell line defective for 8OG DNA repair. Specifically, we employed CRISPR-Cas9 technology to knock out 8-oxoguanine DNA glycosylase (OGG1) and MUTYH glycosylase, two key enzymes involved in the base excision repair of 8OG. The double knock-out (DKO) AS52 cells were found to be more sensitive to PQ toxicity than the parental (WT) AS52 cell line. They experienced higher levels of ROS, which translated into more DNA double-strand breaks, which explained the PQ toxicity. The increased ROS levels also led to more 8OG genomic accumulation, and a higher level of mutations in the DKO cells, suggesting that PQ mutagenesis is mediated primarily by 8OG genomic accumulation. Consistent with this view, antioxidant co-treatment lowered induced cellular ROS and PQ-induced mutagenesis. Taken together, our data demonstrate the strong protective role of OGG1 and MUTYH against PQ-induced mutagenesis. Moreover, our experiments establish the engineered OGG1−/−MUTYH−/− AS52 cell line and associated methods as a versatile cellular system for studying in quantitative terms the mutagenesis of other agents, environmental or endogenous, that induce oxidative stress.
Keywords: pesticide, redox cycling, environmental mutagen, carcinogen
1. Introduction
Oxidative stress is an important consequence of aerobic cellular metabolism; it can also be induced by environmental agents. A hallmark of oxidative stress is the excessive formation of reactive oxygen species (ROS), which can react with DNA to generate mutagenic lesions. An important oxidative DNA lesion is 8-oxoguanine (8OG), which results from oxidation at the C-8 position of guanine. In the absence of DNA repair, 8OG is highly mutagenic because, when traversed by replicative polymerases, it can base pair with adenine (in addition to cytosine), thus inducing G to T mutations [1–7].
Several DNA repair pathways have evolved to protect against oxidative DNA damage. Among these, base excision repair (BER) is the primary pathway that counteracts the mutagenic effects of oxidative DNA lesions by specifically recognizing and removing the modified bases by cleavage of the N-glycosyl bond. In the case of 8OG, BER involves the activity of 8-oxoguanine DNA glycosylase (OGG1) and MutY homolog (MUTYH), enzymes responsible for removing 8OG (when paired with C) and the mismatched adenine across from 8OG (which leads to mutations), respectively [3, 7, 8]. Defects in these glycosylases lead to excessive accumulation of oxidative stress-induced mutations, and an elevated cancer incidence, as shown in several mouse knockout models (Mutyh−/−Ogg1−/−) [3, 6, 9–11].
The BER pathway protects both the nuclear and the mitochondrial DNA. The mitochondrial BER employs isoforms of the nuclear enzymes and in general, involves simpler protein complexes [12]. Given that the inactivation of BER enzymes in most genetic models disrupts the repair of both nuclear and mitochondrial DNA, the specific role of the mitochondrial OG repair in toxicity of xenobiotics, or in cancer development is not completely established.
In addition to BER, oxidative-stress induced DNA lesions can be repaired by nucleotide excision repair (NER) [7, 13, 14]. Both pathways generate single-strand breaks (SSBs) in DNA as repair intermediates. If the level of lesions is high, or if the repair is happening concurrent with replication, much more lethal double-strand breaks (DSBs) can occur [13–15]. Therefore, when the capacity to repair SSB is exceeded, or is compromised, the survival of the cell depends on its ability to repair DSBs using either homologous recombination (HR) or non-homologous end-joining (NHEJ) [15, 16].
Paraquat (1,1′-dimethyl, 4,4′-bipyridinium dichloride; PQ), one of the most widely used herbicides especially in developing countries, has been on the market for the past 60 years. PQ is known as an intracellular generator of ROS through redox cycling and/or mitochondrial electron transport chain disruption [17], which results in extensive mitochondrial damage and cell toxicity [17–19]. The cytotoxicity and genotoxicity of PQ, likely related to its ability to produce ROS, are well established [2, 19–24]. However, the mutagenic consequences of PQ and the genetic and biochemical factors that protect against PQ are less understood. By generating oxidative DNA damage that can lead to mutations, PQ may be both mutagenic and carcinogenic [1, 2]. Epidemiological studies have correlated PQ exposure with an increased incidence of certain skin cancers such as lip cancer, penile cancer, non-melanomous skin cancer, skin melanoma, and skin squamous cell carcinoma [18, 25, 26]. A weak potential mutagenic and genotoxic activity of PQ has been documented in vitro and in cell culture. PQ significantly increased the frequency of chromosome aberrations (CA), micronuclei (MN), sister-chromatid exchanges (SCE), and DNA strand breaks in peripheral blood human lymphocytes [20, 21, 23] and human transformed cell lines (HeLa and Hep G2) [23]. PQ-induced CA, DNA damage, and mutation have been observed in human lung cancer cell lines [2] and V79 Chinese hamster cells [19, 24]. In some animal model studies, PQ was found to increase the level of 8OG in various rat organs [27], CA in mouse bone marrow [28], sperm-shape abnormalities in rodent spermatozoa [28, 29], and DNA damage in the erythrocytes of tadpoles [30]. Other studies, however, failed to detect an increase in hypoxanthine phosphoribosyl transferase (HPRT) gene mutation in V79 Chinese hamster cells [19] and the level of 8OG in rat organs even at toxic doses of PQ [31]. Therefore, additional research is warranted to clarify the mutagenic and genotoxic properties of PQ, as well as the mechanisms by which PQ induces mutations.
A versatile method for measuring mutagenesis in mammalian cells employs the AS52 cells, which are a Chinese hamster ovary (CHO) cell line engineered to carry the bacterial xanthine-guanine phosphoribosyltransferase (gpt) gene, instead of the mammalian homolog HPRT (which is knocked-out). Using a forward mutagenesis assay, gpt mutants in AS52 cells can be selected by their ability to grow in the presence of 6-thioguanine (6-TG) [32–34]. However, for a weak mutagen such as PQ, the AS52 cell model is sensitivity-challenged, owing to the presence of only a single chromosomally integrated copy of gpt gene. To increase the sensitivity of this model, the present study introduces an AS52-derived cell line in which the Ogg1 and Mutyh glycosylases have been knocked out using CRISPR-Cas9 technology. By lacking repair enzymes that counter oxidative stress, the new cell line (AS52DKO) is more suitable for quantifying the mutagenic effects of PQ, and may constitute a useful screening tool for studying oxidative stress-induced mutagenesis.
The key finding of the present study is that the toxicity and mutagenicity of PQ are significantly increased in our genetically engineered hamster cell culture system that lacks the OGG1 and MUTYH DNA glycosylases. This result implicates that the “GO” repair pathway (of which OGG1 and MUTYH are part of) is a critical modulator of PQ toxicity and mutagenicity, and suggests that genomic accumulation of 8OG is the main driver of PQ-induced mutagenesis. Moreover, the cellular system described here (the DKO cell line and associated methods) constitutes a versatile toolbox that enables the study in quantitative terms the role of the OGG1 and MUTYH glycosylases in modulating the toxicity and mutagenicity of other agents that induce oxidative stress (Figure 1).
Figure 1.
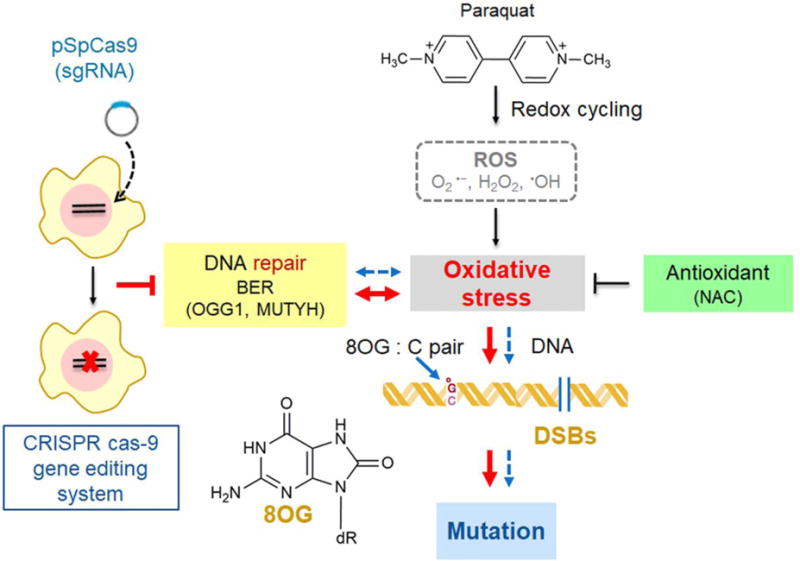
A model of a new AS52-derived cell line deficient in two enzymes involved in the repair of 8OG in DNA. PQ generates ROS such as superoxide anion (O2• −), hydrogen peroxide (H2O2), and hydroxyl radical (•OH) through redox cycling. The imbalance between free radicals production and their elimination by the defense mechanisms causes oxidative stress resulting in DNA base modification mainly at C-8 position of guanine (8OG) which is a highly mutagenic base lesion and DNA strand breakage. CRISPR-Cas9 technology was employed to knock out 8-oxoguanine DNA glycosylase (OGG1) and MUTYH glycosylase, two key enzymes involved in the BER. OGG1−/−MUTYH−/− AS52 cells were found to be more sensitive to PQ than the parental AS52 cell line. More 8OG genomic accumulation, more double-strand breaks and higher level of mutations were generated in this model. Normal pathway in cells is depicted as blue lines and defective for 8OG DNA repair condition is depicted as big red lines.
2. Materials and methods
2.1 Cell culture and chemicals
AS52 cells were cultured in Ham’s F-12 medium (Gibco, USA) supplemented with 10% heat-inactivated (56°C for 30 minutes) fetal bovine serum (FBS) (Merck Millipore, Germany), 100 units/ml penicillin, 100 μg/ml streptomycin, and 2 mM L-glutamine (Gibco) at 37°C in a humidified 5% CO2 incubator. To remove the spurious or pre-existing 6-thioguanine resistant (6-TGr) mutants, cells were cultured in the presence of mycophenolic acid (MPA) (Sigma-Aldrich, USA) for 7 days. The MPA-containing medium was the complete medium (above) supplemented with 10 μg/ml MPA, 250 μg/ml xanthine (Sigma-Aldrich), 22 μg/ml adenine (Sigma-Aldrich), 11 μg/ml thymidine (Sigma-Aldrich), and 1.2 μg/ml aminopterin (Sigma-Aldrich) [33, 34]. Thereafter, cells were maintained in complete medium plus 11.5 μg/ml xanthine, 3 μg/ml adenine and 1.2 μg/ml thymidine for 3 additional days. Cells were used immediately or stored frozen at −80°C. All experiments in this study were carried out within 10 passages after the MPA treatment. Paraquat, 6-thioguanine, hydrogen peroxide, bleomycin, and N-Acetyl-L-cysteine were purchased from Sigma-Aldrich.
2.2 Generation of AS52 double knockout (Ogg1−/−Mutyh−/−) cell lines
Target selection for single-guide RNA (sgRNA)
The sgRNA guides were designed using “CRISPY”, an online design tool specific for CHO cells (http://staff.biosustain.dtu.dk/laeb/crispy/) [35]. Guides were chosen as close as possible to the beginning of the coding sequence of each of the target genes; the number of potential off-target sequences that differ by only 1 base in the guide sequence was kept at <2. The potential off-target sequences were evaluated by BLAST to confirm that they mapped outside any gene-coding, annotated DNA in the hamster genome.
The sgRNA construction and delivery
The sgRNA expression plasmids were constructed by cloning a pair of complementary oligonucleotides into the pSpCas9(BB) vector, using published methods [36]. The pSpCas9(BB)-2A-Puro plasmid (PX459) V2.0 was a gift from Feng Zhang (Addgene plasmid #62988). The sequences of the guide oligonucleotides used for each target are given in Table S1. The newly constructed pSpCas9 vectors were amplified in E. coli (DH5alpha) and isolated by QIAprep spin miniprep kit (QIAGEN, USA). The correct constructs were verified by Sanger sequencing using the U6-Fwd primer (5′-GAGGGCCTATTTCCCATGATTCC-3′). Thereafter, AS52 cells were transfected with these sequence-verified plasmids (500 ng) using Lipofectamine® 2000 transfection reagent (Life Technologies, USA). The transfected cells were selected by the resistance to 5 μg/ml puromycin dihydrochloride (Sigma-Aldrich). The concentration was selected based on dose-response curves of AS52 cells with puromycin.
Clonal isolation of cell lines
The transfected cells were clonally isolated by serial dilution to single cells. Single cells were then expanded to derive mutant (knock-out) clones [36]. For each cell line, a master stock was created and portions were thawed for each experiment, to ensure reproducibility.
SURVEYOR nuclease assay determined targeted gene mutations
Each clone isolated above was analyzed for small insertion or deletion (indel) mutations using either the SURVEYOR nuclease assay or sequencing [36]. Amplicons spanning the different targeted regions were polymerase chain reaction (PCR)-amplified using the Herculase II fusion polymerase (Agilent Technologies, USA); the SURVEYOR nuclease assay was conducted using the SURVEYOR mutation detection kit (Transgenomic, USA) following the manufacturer’s instructions. The cleavage bands were visualized by agarose gel electrophoresis in order to determine Cas9-mediated cleavage efficacy [36]. Sanger sequencing (Genewiz, USA) of the PCR products then revealed the specific DNA alterations induced by CRISPR-Cas9. The primer sequences are listed in Table S2.
2.3 Determination of cell viability by the PrestoBlue™ assay
AS52 cells were seeded in 96-well plates (2,500 cells/well) and allowed to attach for 24 h. Subsequently, cells were exposed to different concentrations of PQ (50-1000 μM) for 24 h. Cell viability was determined by adding to each well 10 μl of PrestoBlue™ cell viability reagent (Invitrogen, USA) and incubating at 37°C for 30 minutes as recommended by the manufacturer. Fluorescence intensity was recorded at 560 nm excitation/590 nm emission using a SpectraMax M3 microplate reader. The data was then expressed as the percentage of cell viability relative to the control group (untreated cells).
2.4 ROS assay using flow cytometry
ROS production was detected using the H2DCF-DA dye (Sigma Aldrich). Once inside the cell, this dye is converted by cellular esterases from a reduced fluorescein derivative (non-fluorescent) into the highly fluorescent 2′,7′dichlorofluorescein (DCF) upon oxidation. The fluorescence intensity is proportional to the level of intracellular ROS. AS52 cells were seeded in 6-well plates (5×10⁵ cells/well) and cultured for 24 h to enable cell attachment. Then, cells were treated with different concentrations of PQ (10, 25, 50, 100, 250, and 500 μM) for 1 h. For the positive control, cells were treated with H2O2 (200 μM) for 15 minutes. Cells were then incubated with 10 μM of H2DCF-DA (Sigma-Aldrich) for 30 minutes at 37°C in the dark, washed with ice-cold phosphate buffer saline (PBS), trypsinized, pelleted at 2300×g for 5 minutes to remove excess H2DCF-DA dye and resuspended with ice-cold PBS. The samples were kept on ice and analyzed immediately on a BD LSRFortessa™ Flow cytometer (BD Biosciences, USA). Fluorescence intensity was recorded in channel FL1 (green fluorescence) using a 488 nm laser for excitation; data was analyzed using BD FACSDiva™ software version 7.0.
2.5 ROS assay by fluorescence live cell imaging
ROS production was detected in living cells using CellROX® Deep Red reagent (Life Technologies, USA). The CellROX® Deep Red reagent is a dye that, upon oxidation, switches from a reduced non-fluorescent form to an oxidized fluorescent form with absorption/emission maxima of 644/665 nm. The fluorescence intensity at 665 nm, as a proxy for intracellular level of ROS, was determined using a fluorescence microscope. AS52 cells were seeded in 96-well plates (7,000 cells/well) and cultured for 24 h to enable cell attachment. Then, the cells were treated with different concentrations of PQ (10, 25, 50, and 100 μM) for 24 h. For the positive control, cells were treated with H2O2 (200 μM) for 4 h. After incubation with the test compounds, cells were washed and incubated with 2.5 μM of CellROX® Deep Red reagent and 1 μg/ml Hoechst 33342 (Molecular Probes, Inc., USA) for 30 minutes at 37°C in the dark. Fluorescence images were captured by using the ImageXpress® Micro XLS system (Molecular Devices, USA) and the fluorescence intensity from each well was quantified using MetaXpress High-Content Image Acquisition and Analysis Software. To determine the level of ROS, the pixel intensity of ROS staining inside the cytoplasm of each individual cell was measured. For each treatment condition, results from >100 individual cells were averaged. Staining with Hoechst 33342 was used to identify nuclei. The mean fluorescence intensity was assumed to reflect relative ROS level.
2.6 Determination of the 8OG levels in genomic DNA using HPLC-MS/MS
AS52 cells were grown in P100 dishes (2×10⁶ cells/dish) and allowed to attach for 24 h. They were treated with different concentrations of PQ (10, 25, 50, and 100 μM) for 24 h. Subsequently, cells were harvested and DNA was isolated using QIAamp® blood Maxi spin column (QIAGEN) following the manufacturer’s instructions. Thereafter, DNA was enzymatically digested to individual deoxynucleosides. The levels of 8OG in DNA were estimated by determining the levels of 8OG deoxynucleoside and deoxyguanosine (dG) in the deoxynucleoside mixture, as previously reported [37]. Briefly, 100 μg of DNA was incubated with 8 U of nuclease P1 at 37°C for 10 minutes. Then, 5 U of alkaline phosphatase were added to the mixture and incubated at 37°C for an additional 2 h. After the enzymatic digestion, the hydrolysate was filtered through a 0.22 μm filter before analysis. The levels of dG and 8OG deoxynucleoside were analyzed on an Agilent 1200 HPLC system equipped with an Agilent 6410 Triple Quad mass spectrometer. The HPLC was connected to a Guanine adduct column (3.0 mm × 150 mm, ESA, Inc., USA) set at 25°C. A flow rate of 0.5 ml/min was used for the mobile phase of 0.1% formic acid (solvent A) and methanol (solvent B); gradient elution occurred from 40% solvent A to 60% solvent B over 12 min. The MS/MS system used an electrospray source operated in positive ion mode. The capillary voltage was 4 kV. The product ion transitions of analytes were monitored in the MRM mode at m/z 284.0 → m/z 168.0 for 8OG deoxynucleoside and m/z 268.0 → m/z 152.0 for dG. The levels of 8OG were expressed as 8OG per 106 G.
2.7 γ-H2AX immunofluorescence assay for DNA strand breakage
DSBs were detected with an immunofluorescence-based assay using a specific primary antibody against the phosphorylated form of histone 2AX (γH2AX) and a secondary antibody conjugated with a fluorescent dye (fluorescein isothiocyanate; FITC). The phosphorylated form, γH2AX, accumulates at the damage sites in DNA, which allows the microscopic visualization as discrete nuclear foci. Thus, γ-H2AX immunofluorescence is very sensitive assay for DSBs detection, including DSBs caused by oxidative stress [38, 39]. AS52 cells were seeded in 96-well plates (7,000 cells/well) and cultured for 24 h to enable cell attachment. Following treatment with different concentrations of PQ (10, 25, 50, and100 μM) for 24 h, or with bleomycin (50 μg/ml) for 30 minutes as the positive control [40], the cells were fixed with 4% paraformaldehyde (Merck, Germany) in PBS (10 minutes at 4°C), and permeabilized using blocking buffer containing 1% bovine serum albumin (BSA) (Sigma-Aldrich) and 0.2% Triton-X 100 (Bio-Rad, USA) in PBS (30 minutes at room temperature). Thereafter, cells were sequentially incubated with the mouse monoclonal anti-phospho-Histone H2A.X (Ser139) primary antibody (1:1000; Merck Millipore) overnight at 4°C and with the Alexa Fluor® 488-conjugated goat anti-mouse secondary antibody (1:250; Jackson ImmunoResearch Inc., USA) for 45 minutes at room temperature. Nuclear DNA was stained with 1 μg/ml Hoechst 33342 (Molecular Probes, Inc., USA) for 45 minutes added together with the secondary antibody. Fluorescence images were captured by using ImageXpress® Micro XLS fluorescence microscope (Molecular Devices, USA); the fluorescence intensity from each cell was quantified using MetaXpress High-Content Image Acquisition and Analysis Software. To determine the level of γH2AX, the pixel intensity of γ-H2AX staining inside the nucleus of each individual cell was measured; the Hoechst 33342 staining was used to identify the nuclei. The relative mean fluorescence intensity of the γ-H2AX staining denoted the relative γH2AX levels.
2.8 gpt mutation assay
AS52 cells were seeded in 6-well plates (5×10⁵ cells/well) and cultured for 24 h to enable cell attachment. Then, cells were treated with different concentrations of PQ (10, 25, 50, and 100 μM) for 24 h, or with H2O2 (100 μM) for 1 h as the positive control [41]. Cells were then trypsinized and cytotoxicity was assessed by trypan blue exclusion. To allow full expression of the gpt mutant phenotype, treated cells were then maintained in complete medium for at least 7 days. Thereafter, treated cells (5×10⁵ cells) were suspended in 100 ml of complete medium containing 10 μM 6-TG to select 6-TG resistant (6-TGr) colonies and seeded at a density of 5×10⁴ cells/100 mm dish (10 dishes/group). Simultaneously, treated cells (2.5×10³ cells) were suspended in 50 ml of complete medium without 6-TG (non-selective conditions) to estimate plating efficiency (PE) and seeded at a density of 500 cells/100 mm dish (5 dishes/group). After a 2 week incubation, colonies were stained with 0.5% crystal violet in 25% methanol and only colonies with ≥ 50 cells were counted. Plating efficiency (PE) and mutation frequency (MF) were calculated as follows:
PE = Number of colonies/Number of seeded cells
MF = Number of 6-TGr colonies/(Number of seeded cells x PE)
2.9 Statistical analysis
The data from at least three independent experiments were presented as the mean ± SEM. Student’s t test was used to determine the statistical significance of differences in cell viability, ROS levels, 8OG levels, γH2AX levels, and mutation frequencies between experimental and control groups. Analyses were done using GraphPad Prism 5 (Graphpad Software, Inc.) and p ≤ 0.05 was considered statistically significant.
3. Results
Generation of AS52 Ogg1−/−Mutyh−/− double knockout cell line
To render AS52 (WT) cells more sensitive to weak oxidative mutagens, we used CRISPR-Cas9 technology to generate AS52 double knockout cells that lack functional OGG1 and MUTYH glycosylases. Three sgRNAs were constructed for targeting Ogg1 in exons 1, 2, and 6 (Figure 2(A)). Two sgRNAs were constructed for targeting Mutyh in exons 2 and 6 (Figure S1(A)). All guides were selected using the “CRISPY” online tool [35]. The genotypes of DKO cells were confirmed by the SURVEYOR nuclease assay on the PCR amplicons of the target sites and by Sanger sequencing of the PCR amplicons (Figure 2(B,C) and S1(B,C)). For the SURVEYOR nuclease assay, primers were used to amplify the Cas9 nuclease target regions, generating amplicons 200-1,000 bp long. Figure 2(A) demonstrates the three sets of primers that were used to amplify the CRISPR target sites on the Ogg1 gene generating amplicons 450, 500, and 800 bp long. As the SURVEYOR nuclease only cleaves a heteroduplex containing a mismatch or a small insertion loop, the PCR amplicons from homozygous cells (wild-type or mutants) remain uncleaved. However, by mixing equimolar amounts of wild-type and mutant DNA, cleavage bands were observed by gel electrophoresis (Figure 2(B) and S1(B,C)), which confirmed the homozygous mutant status of the locus investigated. Subsequently, Sanger sequencing of the amplicons from homozygous mutants was used for confirm the mutant status at the targeted loci (Figure 2(C)). The mutations were all frameshifts caused by insertions and deletions, which in each case lead to either aberrant reading frames and/or premature stop codons leading to truncated proteins.
Figure 2.
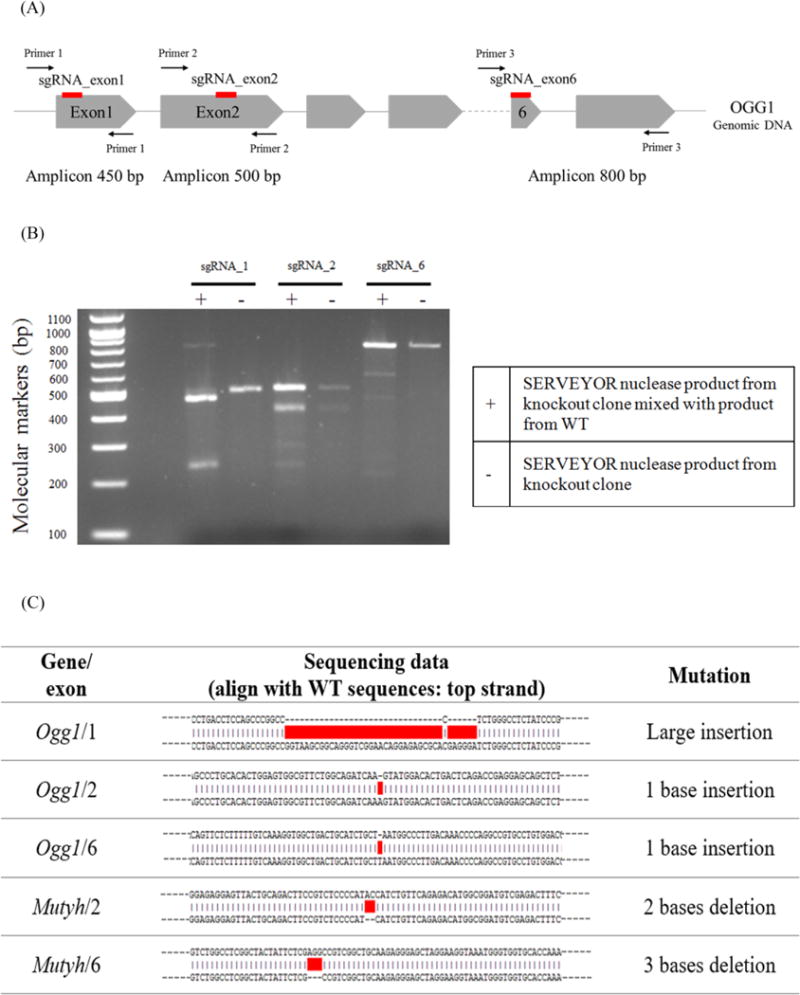
Inactivating DNA repair genes using CRISPR-Cas9 system. (A) Illustration of the genomic sites in the Ogg1 gene targeted by CRISPR-Cas9. Red lines denote the position of the sgRNA target sites in exons 1, 2, and 6, respectively. Introns are depicted as gray lines (not drawn to scale) and exons as gray arrowed boxes (not drawn to scale). (B) Genotyping analysis using the SURVEYOR assay. To confirm the mutant status of a clone at a given target location, the mutant DNA is mixed with wild type genomic DNA in equal proportion, denatured and reannealed (lanes denoted with “+“). The SURVEYOR nuclease only detects and cleaves heteroduplexes, generating a characteristic pattern of bands, which indicate the presence of insertion/deletion (indel) mutations in the knockout clones. In the absence of wild type genomic DNA (lanes denoted with “-“), the unique band observed indicates a homozygous mutant clone (both alleles have been knocked out). (C) The genomic sequences from several knockout clones, when compared to the WT sequence, reveal indel mutation introduced by the CRISPR-Cas9 system.
PQ induced cytotoxicity in both AS52 WT and DKO cells
PQ cytotoxicity has been previously attributed to its ability to induce oxidative stress. We hypothesized that the AS52DKO cells, which lack the ability to repair oxidative lesions, would be more sensitive to PQ exposure. To test this hypothesis, the AS52 WT and DKO cells were treated with various concentrations of PQ (50-1,000 μM) and their viability evaluated after 24 h. As shown in Figure 3, both cell lines were sensitive to PQ exposure; however, the DKO cells were more sensitive (IC50 = 350 ± 94 μM) than the WT cells (IC50 = 640 ± 185 μM). The viability of the DKO cells was significantly lower for concentrations higher than 250 μM. A similar result was observed when the cells were exposed to PQ for 48 h (Figure S2).
Figure 3.
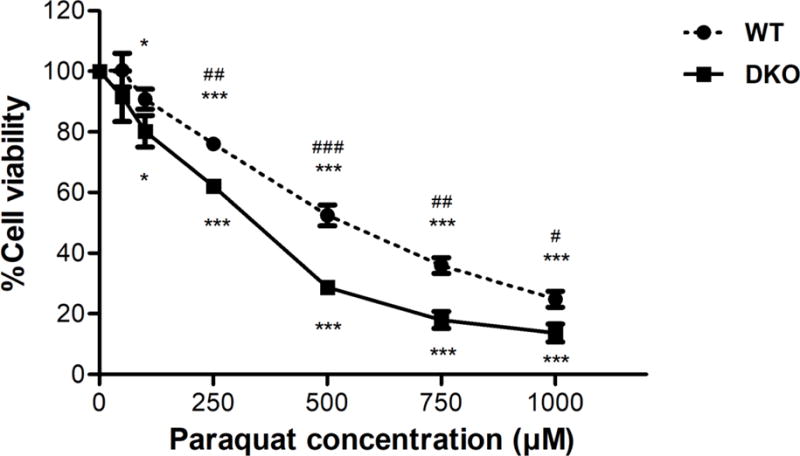
Effect of PQ on cell death in AS52 WT and DKO cells. Cells were treated with various concentrations of PQ (50-1,000 μM) for 24 h. The results are presented as mean ± SEM, N = 4. *p < 0.05, ***p < 0.001 compared with the control (untreated group). #p < 0.05, ##p < 0.01, ###p < 0.001 WT compared with DKO cells.
PQ generated ROS in both AS52 WT and DKO cells
PQ has been reported to generate ROS by redox cycling [17–19]. To evaluate the acute induction of ROS by PQ in our cell lines, AS52 WT and DKO cells were exposed to increasing doses of PQ for 1 h. Subsequently, the redox-sensitive dye H2DCF-DA was added and its fluorescence measured in individual cells using flow cytometry. For a positive control, treatment with 200 μM of H2O2 (an established ROS) for 15 minutes generated a substantial increase in the level of fluorescence in both cell lines (Figure S5). As shown in Figure 4, PQ significantly increased ROS levels in both cell lines at concentrations above 50 μM. DKO cells experienced significantly higher levels of ROS relative to WT cells, both in the H2O2 control treatment and with PQ doses 250 μM or higher. The higher level of ROS in the DKO cells is consistent with the PQ cytotoxicity data (Figure 3) and implicates ROS as (one of) the effectors of PQ toxicity.
Figure 4.
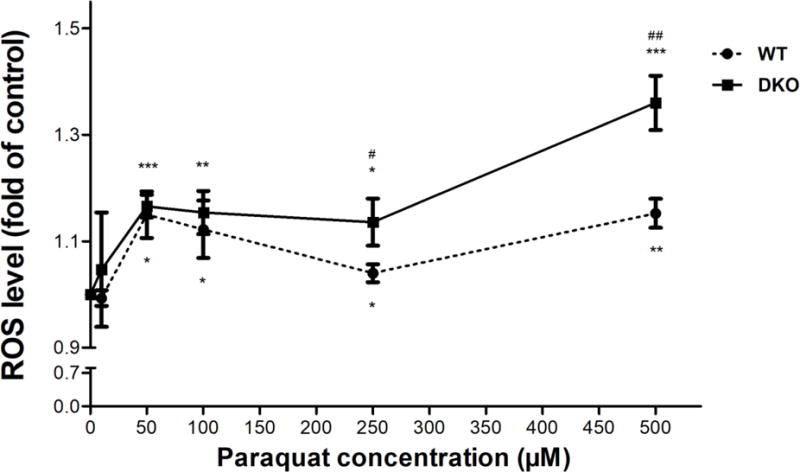
PQ induces acute ROS generation in AS52 WT and DKO cells. Cells were treated with various concentrations of PQ (10-500 μM) for 1 h and the levels of induced ROS were evaluated with the H2DCF-DA molecular probe. The fold change in the fluorescence levels of DCFDA (a proxy for ROS levels), relative to untreated cells, is reported on the Y-axis relative. The results are presented as mean ± SEM, N = 4. *p < 0.05, **p < 0.01, ***p < 0.001 compared with the control (untreated group). #p < 0.05, ##p < 0.01 WT compared with DKO cells.
PQ exposure also generated a chronic increase in ROS levels. After exposing cells to low doses of PQ for 24 h, the redox-sensitive dye CellROX® Deep Red reagent was added and its fluorescence at 665 nm, representing a proxy for the intracellular levels of ROS, was measured by fluorescence live cell imaging. For a positive control, treatment with 200 μM of H2O2 for 4 h generated substantial increases in ROS in both cell lines (Figure S6). PQ significantly increased ROS levels at concentrations above 10 μM in WT and 50 μM in DKO cells (Figure 5). The basal level of ROS in DKO cells were significantly higher than in the WT; however, there was no significant difference in the ROS levels between WT and DKO at PQ concentrations above 25 μM. Thus, our results indicate that PQ-induced ROS is generated acutely (as early as 1 h) but it also persists chronically at 24 h.
Figure 5.
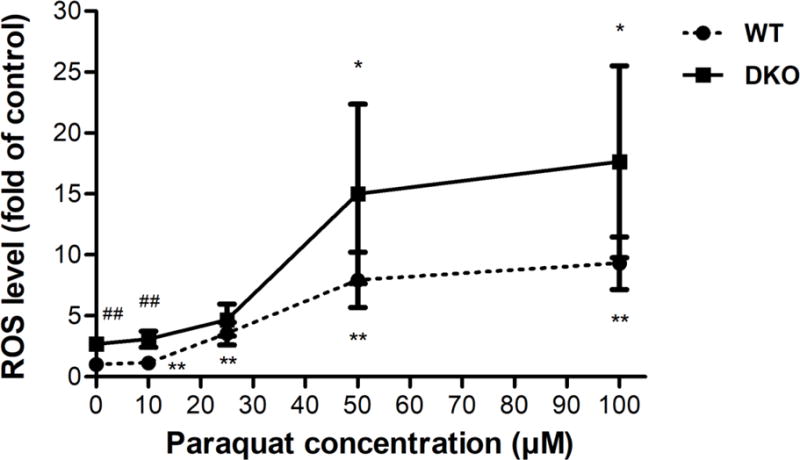
PQ induces chronic ROS generation in AS52 WT and DKO cells. Cells were treated with various concentrations of PQ (10, 25, 50, and 100 μM) for 24 h. The intracellular levels of ROS were measured by fluorescence live cell imaging. The fold change in CellROX® fluorescence relative to untreated WT cells (a proxy for relative ROS levels) is shown on the Y axis. The results are presented as mean ± SEM, N = 6. *p < 0.05, **p < 0.01 compared with the control (untreated group). ##p < 0.01 WT compared with DKO cells.
PQ induced oxidative DNA damage in both AS52 WT and DKO cells
The PQ-induced ROS and oxidative stress are known to cause DNA damage, in the form of oxidized bases (like 8OG), or damage to the DNA backbone. To evaluate the capacity of PQ to induce oxidative DNA damage, the levels of 8OG in the genomes of treated cells were measured. Our hypothesis was that in the AS52DKO cells, which lack the ability to repair 8OG, PQ would induce a higher level of 8OG compared to AS52 WT cells.
We measured the formation of 8OG in both AS52 WT and DKO cells following a 24 h exposure to various concentrations of PQ (10, 25, 50, and 100 μM); the results are shown in Figure 6. The basal level of 8OG in AS52DKO was significantly higher than WT, reflecting the fact that in the absence of efficient repair, 8OG generated by endogenous processes would accumulate in the genome. At 100 μM PQ, the levels of 8OG in both cell lines were found to be significantly higher (~1.5 fold increase) than their respective untreated controls.
Figure 6.
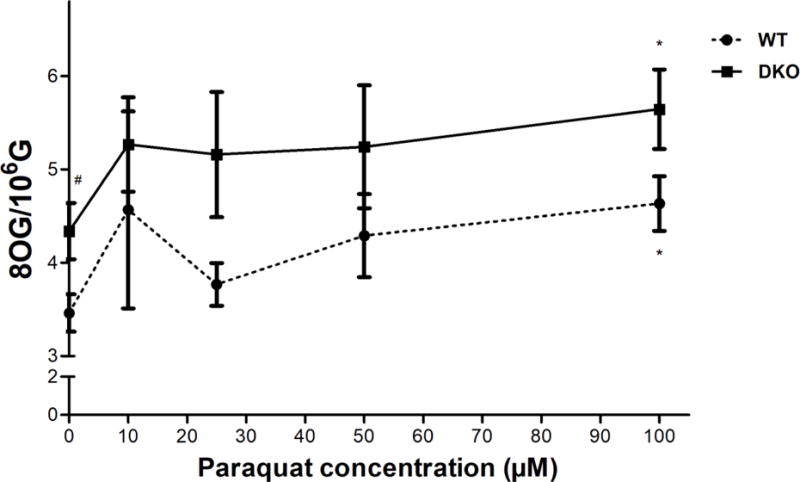
PQ induced accumulation of 8OG (oxidative DNA damage) in both AS52 WT and DKO cells. Cells were treated with various concentrations of PQ (10, 25, 50, and 100 μM) for 24 h. The genomic levels of 8OG were evaluated using a mass spectrometry based method. The results are presented as mean ± SEM, N = 4. *p < 0.05 compared with the control (untreated group). #p < 0.05 WT compared with DKO cells.
PQ induced DSBs in both AS52 WT and DKO cells
To determine whether PQ-induced ROS generated DSBs, the levels of phosphorylation of the histone 2 AX (γH2AX), a highly specific biomarker of DSBs, were measured in the AS52 WT and DKO cells. Both cells were treated with various concentrations of PQ (10, 25, 50, and 100 μM) for 24 h or with bleomycin (50 μg/ml) for 30 minutes as a positive control [40]. As shown in Figure 7, PQ increased the levels of γH2AX in a concentration-dependent manner. The levels of γH2AX in DKO cells were significantly higher than in WT cells (p < 0.05) for all every concentrations of PQ treated. Interestingly, untreated DKO cells also had a higher basal level of γH2AX (p < 0.001), presumably reflecting increased basal levels of stress. When comparing treated cells with their respective untreated control, the WT cells required 100 μM of PQ to develop a statistically significant increase in γH2AX levels, while the DKO cells showed higher levels starting at 25 μM of PQ. The positive control bleomycin induced as expected, high levels of γH2AX in both cell lines (Figure S7).
Figure 7.
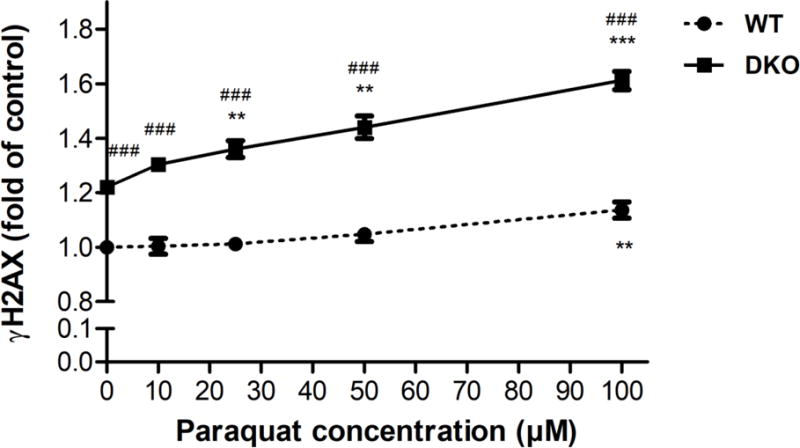
PQ induced DSBs in both AS52 WT and DKO cells. Cells were treated with PQ (10, 25, 50, and 100 μM) for 24 h and the relative levels of DSBs estimated by measuring the levels of γH2AX relative to untreated WT cells. The results are presented as mean ± SEM, N = 3. **p < 0.01, ***p < 0.001 compared with the control (untreated group). ###p < 0.001 WT compared with DKO cells.
Mutagenesis of PQ in AS52 WT and DKO cells
The mutagenesis of PQ was evaluated by counting the 6-TG resistant (6-TGr) colonies relative to the total number of colony-forming units plated. As above, cells were first exposed to PQ at concentrations ranging from 10-100 μM for 24 h. For a positive control, a 1 hour treatment with 100 μM H2O2 was performed. At all concentrations tested, PQ induced a significant increase in mutation frequency; for WT cells, MF increased from 9 per 105 6-TGr colonies (the detection limit of the assay) to 486 per 105, while for DKO cells, MF increased from 366 per 105 to 1,647 per 105 colonies (Figure 8). The positive control induced substantial number of 6-TGr colonies (Figure S10), consistent with previously reported data [41]. Taken together, the data demonstrate that PQ is mutagenic in both AS52 WT and DKO cell lines. The striking increase in the mutant fraction seen in the DKO cell lines suggests the mutagenesis is caused in part by oxidative stress-induced DNA lesions.
Figure 8.
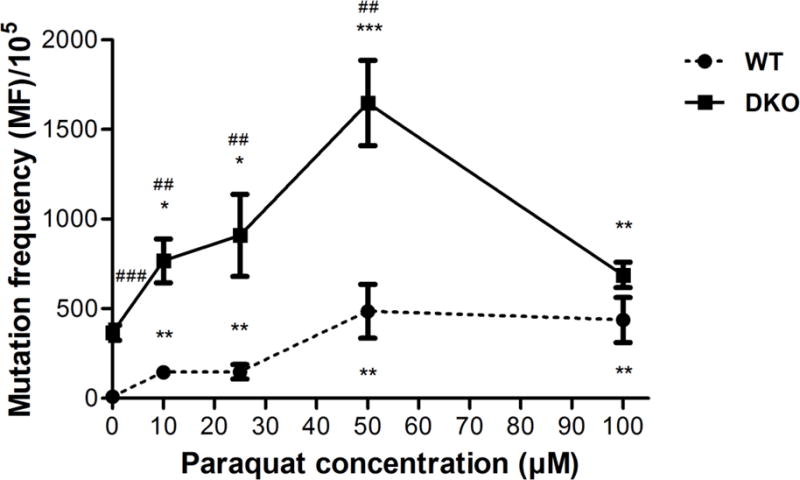
PQ is mutagenic in WT and DKO cells as evidenced by the induction of 6-TGr mutants in AS52 WT and DKO cells. Cells were treated with PQ 10, 25, 50, and 100 μM for 24 h and the number of 6-TGr mutants resulting in each case was determined. The results are presented as mean ± SEM, N = 5. *p < 0.05, **p < 0.01, ***p < 0.001 compared with the control (untreated group). ##p < 0.01, ###p < 0.001 WT compared with DKO cells.
The antioxidant NAC decreases the mutagenesis of PQ
To further probe the mechanism of PQ-induced mutagenesis, we evaluated the mutagenesis of PQ in cells co-treated with NAC, a commonly used antioxidant. NAC can act both as a free radical scavenger, directly reducing the available concentration of ROS, and as a cysteine source, which helps restore and boost the levels of glutathione, the main cellular antioxidant. AS52 WT cells were treated with 25 μM of PQ, 2 mM of NAC, and the combination of PQ 25 μM + NAC 2 mM for 24 h. As seen in Figure 9, even in AS52 WT cells, exposure to 25 μM of PQ generated significantly increased MF relative to the untreated cells (p < 0.05). However, co-treatment with 2 mM NAC completely abrogated the PQ-induced mutations, consistent with the hypothesis that the PQ mutagenesis is dependent on the generation of ROS and oxidative-stress induced DNA damage.
Figure 9.
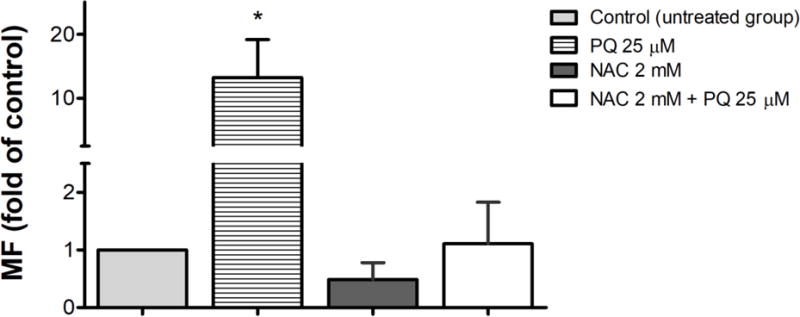
Antioxidant decreased the number of 6-TGr mutants caused by PQ in AS52 WT cells. AS52 WT cells were treated with PQ 25 μM, NAC 2mM, and the combination of PQ 25 μM + NAC 2 mM for 24 h. The results are presented as mean ± SEM, N = 3. *p < 0.05 compared with the control (untreated group).
4. Discussion
The present study investigated the toxicity and mutagenicity of PQ in a mammalian cell culture system in which the cells were specifically modified in their ability to repair oxidatively damaged DNA. We showed that OGG1 and MUTYH DNA repair enzymes play an important role in the prevention of PQ-induced mutagenesis by generating (using CRISPR-Cas9 methods) and testing a double knock-out (Ogg1−/−Mutyh−/−) cell line.
The central goal of this study was to evaluate in quantitative terms the mutagenic potential of PQ in vitro in the aforementioned cell lines. By virtue of inducing oxidative stress, PQ may be mutagenic and carcinogenic, but conclusive evidence has been lacking. A weak mutagenic activity has been attributed to PQ in vitro [2, 18–21, 23, 24] but not in vivo [31]. However, the genotoxic potential of PQ is well established [27–30]. In this study, the mutagenic properties of PQ were measured by enumerating mutants in the gpt transgene of the AS52 cells with 6-TG. To improve the sensitivity of the assay, and to strengthen the association between observed mutations and oxidative stress, a cell line lacking the activities of OGG1 and MUTYH glycosylases was constructed using CRISPR-Cas9 nuclease methodology. The A52DKO cells lack the ability to efficiently remove 8OG (an abundant oxidation-induced DNA lesion) and prevent its mutagenesis, thus constituting a highly sensitive mutagenic reporter for oxidative stress. Consistent with its genotype, the DKO cell line had an increased MF even in the absence of PQ treatment. The basal MF in untreated DKO cells was 3.6±0.4 × 10⁻³, a two-order of magnitude increase (p<0.001) over the basal MF in WT cells, which was 9.2±2.1 × 10⁻⁵. Additionally, the DKO cells showed morphological changes, a growth defect (longer doubling time), and increased basal levels of ROS, genomic 8OG and double-strand breaks (Figures 6,7,8).
The present study shows that exposure of AS52 WT or DKO cells to PQ results in a substantial increase in ROS, as early as 1 h post exposure (Figure 4). The ROS increase is dose dependent and correlates with the cytotoxic effect of PQ (Figure 3). Previous studies have documented the ability of PQ to redox cycle resulting in generation of ROS and extensive mitochondrial damage [17–19]. Among the different ROS, the superoxide anion radical, has been observed and reported [2, 19–22]; H2O2 has also been observed being induced in a dose-dependent manner [22, 42, 43]. ROS-dependent cell death was also reported in other cultured mammalian cells, such as human promyelocytic leukemia HL-60 cells [22], RAW264.7 cells [42], and human neutrophils [43].
To ascribe the mutagenic properties of PQ conclusively to its ability to generate oxidative-stress induced DNA lesions, we constructed the A52DKO cell line, lacking OGG1 and MUTYH glycosylases. Previous studies have shown that cells deficient in Ogg1 and Mutyh are sensitive to oxidants, in part because of the negative effects of oxidative stress on cell-cycle progression [3]. These observations are in accord with studies showing that increased levels of ROS are associated with cell death [22, 42, 43], as well as DNA damage [44]. There should be a substantial increase in ROS levels when cells are severely repair-deficient. Our finding confirmed that cells deficient in the repair mechanism display enhanced sensitivity to oxidative stress. Cells deficient in Ogg1 and Mutyh accumulated more endogenous DNA damage, which correlated with an elevation of ROS levels and cell death.
The levels of 8OG were used as a marker of oxidative stress in DNA repair-proficient cells (AS52 WT) [15]. As expected, our data showed significant differences in the 8OG basal levels between WT and DKO cells. Higher 8OG basal level in DKO cells confirms the successful knockout by CRISPR-Cas9 of the target DNA repair genes. It has been previously shown that cells deficient in both Ogg1 and Mutyh have a higher burden of 8OG in their genome, which is consistent with the role of Ogg1 and Mutyh in preventing 8OG formation and mutagenesis [3, 9, 10, 45, 46]. The levels of 8OG we found in our model are also comparable with other published data [15, 41, 47]. We expected to see higher levels of 8OG in DKO cells for all concentrations of PQ. There was a trend toward higher levels of 8OG in cells knocked out for repair of this modified base, but the expected differences between repair proficient and deficient cells did not reach a level of statistical significance.
We found that the levels of γH2AX (a marker of DSBs) in DKO cells were significantly higher than in WT cells in untreated cells and across all PQ concentrations tested. Our finding extends those of a previous study that showed the co-depleted cells (FEN1-BRCA1 and XRCC1-BRCA1) had lower levels of 8OG when compared to BRCA1/FEN1/XRCC1 single depleted cells [15]. Cells deficient in mechanistically distinct DNA repair pathways are pushed into a high oxidative stress environment as a survival mechanism called an “adaptive response,” which has been seen in cancer cells. There are several overlapping and cross-talking mechanisms among DNA repair pathways. When SSBs repair intermediates caused by oxidative damage are created and persist into S-phase, they can become DSBs during replication and then require HR or NHEJ to be repaired [13–16]. The present study showed that PQ-induced DSBs were dose-dependent and, therefore, correlated with the level of oxidative stress. At concentrations at which cell viability and ROS levels were not significantly different between WT and DKO cells, we could detect differences in the levels of DSBs, even at very low concentrations of PQ in DKO cells.
This study showed that oxidative stress produced from PQ correlated with the amount of mutagenesis detected in the gpt gene. PQ was mutagenic to both AS52 WT and DKO cells even at low concentrations, with the DKO cells experiencing a higher mutation burden. Oxidative stress may not only induce DNA damage directly, but it can also inhibit DNA repair enzymes resulting in an increased accumulation of mutations [2, 4, 5, 48]. Our mutagenesis data are consistent with previous studies, which found that PQ mutagenesis occurred in a concentration-dependent manner [2]. Moreover, results from our DKO cell line also indicate that PQ-induced mutations can be attributed to ROS-induced DNA damage. Therefore, DNA repair pathways, such as BER may be important modulators of PQ mutagenesis, a notion consistent with previous studies [3].
Regarding the toxicological importance of this study, it is the first to show in vivo that mutations caused by PQ are enhanced in cells compromised for the BER parameters studied here, namely the glycosylases OGG1 and MUTYH. From the public health perspective, there are cohorts who naturally lack or are impaired in these repair pathways. Those individuals would be at enhanced risk compared to people who are enabled for these repair steps. Several examples follow.
Published studies have shown that the levels of 8OG in tissues are positively associated with the incidence of cancer. There is epidemiological evidence from the workers involved with PQ manufacturing who were exposed to bipyridines [25, 26]. Squamous cell skin carcinoma has been strongly associated with the combination of sunlight and PQ exposure for 5-14 months [25]. Another study also found an excess of skin melanoma in workers on banana farms observed for 1-37 months [26]. Taken together, there is good evidence that cancer incidence is associated with chronic exposure with PQ. It is possible that PQ contributes to cancer induction by mutagenic mechanisms that could be explained using our transgenic cell culture model.
Another in vivo study, this one in rodents, showed a significant increase in the level of 8-hydroxy-deoxyguanosine (8-OH-dG) in rat brain at day 3, 5, and 7 [27] after exposure to PQ. In another study, the increase in 8-OH-dG was found in mouse liver after PQ exposure for 3 weeks [47]. While no studies explicitly have assessed the dose/duration of exposure parameters of PQ induction of genetic disease, we have recently provided an animal model (the B6C3F1 gpt delta mouse) in which that hypothesis can be tested in a future study. The B6C3F1 gpt delta mouse carries 80 copies of the gpt gene integrated into its DNA, which enables a very accurate measurement of the in vivo mutagenic effects of environmental agents [49].
There is currently no specific treatment for PQ poisoning. However, given the ability of PQ to induce oxidative stress, several studies suggest an antioxidant therapy as a potential treatment [41, 50, 51]. For example, supplementation with NAC, a common antioxidant, diminishes the oxidative stress induced by PQ [41, 47]. The present work demonstrates that NAC is also sufficient to alleviate the mutagenic properties of PQ (Figure 9), further strengthening the notion that the mutagenic property of PQ is largely due to the formation of ROS and oxidative DNA lesions.
Our results suggest that the new cell model (AS52DKO) is a sensitive tool to study mutagenic effects of weak oxidative mutagens or low dose exposure to environmental agents that induce oxidative stress. Using this model, we have established that PQ is mutagenic and cytotoxic, its properties stemming from its ability to generate ROS and induce genomic accumulation of oxidative DNA lesions such as 8OG. The system described is well poised to enable deeper analysis of PQ mutagenesis in terms of the specific types of point mutations induced, and mutational spectra, both in the AS52 cells, and in an animal model (e.g., B6C3F1 gpt delta mouse [34, 49]).
Supplementary Material
Acknowledgments
Support for this work was provided by the National Institutes of Health grants P01 CA26731 (to J.M.E), R01 CA080024 (to J.M.E.) and P30 ES002109. P.T. was supported by a grant from the Graduate Program in Environmental Toxicology, Chulabhorn Graduate Institute (His Majesty the King Honour Celebration Scholarships Project for the Scientists Development 23/2555) and Center of Excellence on Environmental Health and Toxicology, Ministry of Education, Bangkok, Thailand. The authors thank Dr. Piyajit Watcharasit and Dr. Benjaporn Homkajorn for their special guidance and helpful discussions.
Abbreviations
- 8OG
8-oxoguanine (also known as 7,8-dihydro-8-oxoguanine)
- BER
base excision repair
- CRISPR
RNA-guided clustered regularly interspaced short palindromic repeats
- DSBs
DNA double-strand breaks
- gpt
xanthine-guanine phosphoribosyltransferase
- MUTYH
mutY DNA glycosylase
- NAC
N-Acetyl-L-cysteine
- OGG1
8-oxoguanine DNA glycosylase
- PQ
paraquat
- ROS
reactive oxygen species
References
- 1.Wang D, Kreutzer DA, Essigmann JM. Mutagenicity and repair of oxidative DNA damage: insights from studies using defined lesions. Mutat Res. 1998;400(1-2):99–115. doi: 10.1016/s0027-5107(98)00066-9. [DOI] [PubMed] [Google Scholar]
- 2.Zienolddiny S, Ryberg D, Haugen A. Induction of microsatellite mutations by oxidative agents in human lung cancer cell lines. Carcinogenesis. 2000;21(8):1521–6. [PubMed] [Google Scholar]
- 3.Xie Y, Yang H, Miller JH, Shih DM, Hicks GG, Xie J, Shiu RP. Cells deficient in oxidative DNA damage repair genes Myh and Ogg1 are sensitive to oxidants with increased G2/M arrest and multinucleation. Carcinogenesis. 2008;29(4):722–8. doi: 10.1093/carcin/bgn033. [DOI] [PubMed] [Google Scholar]
- 4.Klaunig JE, Kamendulis LM, Hocevar BA. Oxidative stress and oxidative damage in carcinogenesis. Toxicol Pathol. 2010;38(1):96–109. doi: 10.1177/0192623309356453. [DOI] [PubMed] [Google Scholar]
- 5.Reuter S, Gupta SC, Chaturvedi MM, Aggarwal BB. Oxidative stress, inflammation, and cancer: how are they linked? Free Radic Biol Med. 2010;49(11):1603–16. doi: 10.1016/j.freeradbiomed.2010.09.006. [DOI] [PMC free article] [PubMed] [Google Scholar]
- 6.Dizdaroglu M. Oxidatively induced DNA damage: mechanisms, repair and disease. Cancer Lett. 2012;327(1-2):26–47. doi: 10.1016/j.canlet.2012.01.016. [DOI] [PubMed] [Google Scholar]
- 7.David SS, O’Shea VL, Kundu S. Base-excision repair of oxidative DNA damage. Nature. 2007;447(7147):941–50. doi: 10.1038/nature05978. [DOI] [PMC free article] [PubMed] [Google Scholar]
- 8.Nakabeppu Y. Cellular levels of 8-oxoguanine in either DNA or the nucleotide pool play pivotal roles in carcinogenesis and survival of cancer cells. Int J Mol Sci. 2014;15(7):12543–57. doi: 10.3390/ijms150712543. [DOI] [PMC free article] [PubMed] [Google Scholar]
- 9.Isogawa A. Functional cooperation of Ogg1 and Mutyh in preventing G: C–>T: a transversions in mice. Fukuoka Igaku Zasshi. 2004;95(1):17–30. [PubMed] [Google Scholar]
- 10.Xie Y, Yang H, Cunanan C, Okamoto K, Shibata D, Pan J, Barnes DE, Lindahl T, McIlhatton M, Fishel R, Miller JH. Deficiencies in mouse Myh and Ogg1 result in tumor predisposition and G to T mutations in codon 12 of the K-ras oncogene in lung tumors. Cancer Res. 2004;64(9):3096–102. doi: 10.1158/0008-5472.can-03-3834. [DOI] [PubMed] [Google Scholar]
- 11.Ohno M, Sakumi K, Fukumura R, Furuichi M, Iwasaki Y, Hokama M, Ikemura T, Tsuzuki T, Gondo Y, Nakabeppu Y. 8-oxoguanine causes spontaneous de novo germline mutations in mice. Sci Rep. 2014;4:4689. doi: 10.1038/srep04689. [DOI] [PMC free article] [PubMed] [Google Scholar]
- 12.Larsen NB, Rasmussen M, Rasmussen LJ. Nuclear and mitochondrial DNA repair: similar pathways? Mitochondrion. 2005;5(2):89–108. doi: 10.1016/j.mito.2005.02.002. [DOI] [PubMed] [Google Scholar]
- 13.Degtyareva NP, Heyburn L, Sterling J, Resnick MA, Gordenin DA, Doetsch PW. Oxidative stress-induced mutagenesis in single-strand DNA occurs primarily at cytosines and is DNA polymerase zeta-dependent only for adenines and guanines. Nucleic Acids Res. 2013;41(19):8995–9005. doi: 10.1093/nar/gkt671. [DOI] [PMC free article] [PubMed] [Google Scholar]
- 14.Woodbine L, Brunton H, Goodarzi AA, Shibata A, Jeggo PA. Endogenously induced DNA double strand breaks arise in heterochromatic DNA regions and require ataxia telangiectasia mutated and Artemis for their repair. Nucleic Acids Res. 2011;39(16):6986–97. doi: 10.1093/nar/gkr331. [DOI] [PMC free article] [PubMed] [Google Scholar]
- 15.Fridlich R, Annamalai D, Roy R, Bernheim G, Powell SN. BRCA1 and BRCA2 protect against oxidative DNA damage converted into double-strand breaks during DNA replication. DNA Repair (Amst) 2015;30:11–20. doi: 10.1016/j.dnarep.2015.03.002. [DOI] [PMC free article] [PubMed] [Google Scholar]
- 16.Kelley MR, Logsdon D, Fishel ML. Targeting DNA repair pathways for cancer treatment: what’s new? Future Oncol. 2014;10(7):1215–37. doi: 10.2217/fon.14.60. [DOI] [PMC free article] [PubMed] [Google Scholar]
- 17.Cocheme HM, Murphy MP. Complex I is the major site of mitochondrial superoxide production by paraquat. J Biol Chem. 2008;283(4):1786–98. doi: 10.1074/jbc.M708597200. [DOI] [PubMed] [Google Scholar]
- 18.Watts M. Paraquat monograph, Pesticide Action Network Asia and the Pacific. Penang, Malaysia: 2011. [Google Scholar]
- 19.Speit G, Haupter S, Hartmann A. Evaluation of the genotoxic properties of paraquat in V79 Chinese hamster cells. Mutat Res. 1998;412(2):187–93. doi: 10.1016/s1383-5718(97)00199-x. [DOI] [PubMed] [Google Scholar]
- 20.Jovtchev G, Gateva S, Stergios M, Kulekova S. Cytotoxic and genotoxic effects of paraquat in Hordeum vulgare and human lymphocytes in vitro. Environ Toxicol. 2010;25(3):294–303. doi: 10.1002/tox.20503. [DOI] [PubMed] [Google Scholar]
- 21.Ribas G, Surralles J, Carbonell E, Xamena N, Creus A, Marcos R. Genotoxic evaluation of the herbicide paraquat in cultured human lymphocytes. Teratog Carcinog Mutagen. 1997;17(6):339–47. [PubMed] [Google Scholar]
- 22.Zhang WH, Yang Y, Lin CJ, Wang Q. Antioxidant attenuation of ROS-involved cytotoxicity induced by paraquat on HL-60 cells. Health (N Y) 2010;2:253–61. [Google Scholar]
- 23.Petrovska H, Dusinska M. Oxidative DNA damage in human cells induced by paraquat. Altern Lab Anim. 1999;27(3):387–95. doi: 10.1177/026119299902700314. [DOI] [PubMed] [Google Scholar]
- 24.Kuo ML, Lin JK. The genotoxicity of the waste water discharged from paraquat manufacturing and its pyridyl components. Mutat Res. 1993;300(3-4):223–9. doi: 10.1016/0165-1218(93)90054-h. [DOI] [PubMed] [Google Scholar]
- 25.Jee SH, Kuo HW, Su WP, Chang CH, Sun CC, Wang JD. Photodamage and skin cancer among paraquat workers. Int J Dermatol. 1995;34(7):466–9. doi: 10.1111/j.1365-4362.1995.tb00611.x. [DOI] [PubMed] [Google Scholar]
- 26.Wesseling C, van Wendel de Joode B, Ruepert C, Leon C, Monge P, Hermosillo H, Partanen TJ. Paraquat in developing countries. Int J Occup Environ Health. 2001;7(4):275–86. doi: 10.1179/107735201800339209. [DOI] [PubMed] [Google Scholar]
- 27.Tokunaga I, Kubo S, Mikasa H, Suzuki Y, Morita K. Determination of 8-hydroxy-deoxyguanosine formation in rat organs: assessment of paraquat-evoked oxidative DNA damage. Biochem Mol Biol Int. 1997;43(1):73–7. doi: 10.1080/15216549700203831. [DOI] [PubMed] [Google Scholar]
- 28.Rios AC, Salvadori DM, Oliveira SV, Ribeiro LR. The action of the herbicide paraquat on somatic and germ cells of mice. Mutat Res. 1995;328(1):113–8. doi: 10.1016/0027-5107(94)00199-f. [DOI] [PubMed] [Google Scholar]
- 29.D’Souza UJ, Narayana K, Zain A, Raju S, Nizam HM, Noriah O. Dermal exposure to the herbicide-paraquat results in genotoxic and cytotoxic damage to germ cells in the male rat. Folia Morphol (Warsz) 2006;65(1):6–10. [PubMed] [Google Scholar]
- 30.Yin XH, Li SN, Zhang L, Zhu GN, Zhuang HS. Evaluation of DNA damage in Chinese toad (Bufo bufo gargarizans) after in vivo exposure to sublethal concentrations of four herbicides using the comet assay. Ecotoxicology. 2008;17(4):280–6. doi: 10.1007/s10646-008-0195-z. [DOI] [PubMed] [Google Scholar]
- 31.Sorensen M, Loft S. No significant paraquat-induced oxidative DNA damage in rats. Free Radic Res. 2000;32(5):423–8. doi: 10.1080/10715760000300421. [DOI] [PubMed] [Google Scholar]
- 32.Tindall KR, Stankowski LF, Jr, Machanoff R, Hsie AW. Detection of deletion mutations in pSV2gpt-transformed cells. Mol Cell Biol. 1984;4(7):1411–5. doi: 10.1128/mcb.4.7.1411. [DOI] [PMC free article] [PubMed] [Google Scholar]
- 33.Tindall KR, Stankowski LF., Jr Molecular analysis of spontaneous mutations at the gpt locus in Chinese hamster ovary (AS52) cells. Mutat Res. 1989;220(2-3):241–53. doi: 10.1016/0165-1110(89)90028-6. [DOI] [PubMed] [Google Scholar]
- 34.Wattanawaraporn R, Kim MY, Adams J, Trudel LJ, Woo LL, Croy RG, Essigmann JM, Wogan GN. AFB(1)-induced mutagenesis of the gpt gene in AS52 cells. Environ Mol Mutagen. 2012;53(7):567–73. doi: 10.1002/em.21711. [DOI] [PMC free article] [PubMed] [Google Scholar]
- 35.Ronda C, Pedersen LE, Hansen HG, Kallehauge TB, Betenbaugh MJ, Nielsen AT, Kildegaard HF. Accelerating genome editing in CHO cells using CRISPR Cas9 and CRISPy, a web-based target finding tool. Biotechnol Bioeng. 2014;111(8):1604–16. doi: 10.1002/bit.25233. [DOI] [PMC free article] [PubMed] [Google Scholar]
- 36.Ran FA, Hsu PD, Wright J, Agarwala V, Scott DA, Zhang F. Genome engineering using the CRISPR-Cas9 system. Nat Protoc. 2013;8(11):2281–308. doi: 10.1038/nprot.2013.143. [DOI] [PMC free article] [PubMed] [Google Scholar]
- 37.Vattanasit U, Navasumrit P, Khadka MB, Kanitwithayanun J, Promvijit J, Autrup H, Ruchirawat M. Oxidative DNA damage and inflammatory responses in cultured human cells and in humans exposed to traffic-related particles. Int J Hyg Environ Health. 2014;217(1):23–33. doi: 10.1016/j.ijheh.2013.03.002. [DOI] [PubMed] [Google Scholar]
- 38.Heylmann D, Kaina B. The gammaH2AX DNA damage assay from a drop of blood. Sci Rep. 2016;6:22682. doi: 10.1038/srep22682. [DOI] [PMC free article] [PubMed] [Google Scholar]
- 39.Mah LJ, El-Osta A, Karagiannis TC. gammaH2AX: a sensitive molecular marker of DNA damage and repair. Leukemia. 2010;24(4):679–86. doi: 10.1038/leu.2010.6. [DOI] [PubMed] [Google Scholar]
- 40.Solovjeva L, Firsanov D, Vasilishina A, Chagin V, Pleskach N, Kropotov A, Svetlova M. DNA double-strand break repair is impaired in presenescent Syrian hamster fibroblasts. BMC Mol Biol. 2015;16:18. doi: 10.1186/s12867-015-0046-4. [DOI] [PMC free article] [PubMed] [Google Scholar]
- 41.Kim HW, Murakami A, Williams MV, Ohigashi H. Mutagenicity of reactive oxygen and nitrogen species as detected by co-culture of activated inflammatory leukocytes and AS52 cells. Carcinogenesis. 2003;24(2):235–41. doi: 10.1093/carcin/24.2.235. [DOI] [PubMed] [Google Scholar]
- 42.Jang YJ, Won JH, Back MJ, Fu Z, Jang JM, Ha HC, Hong S, Chang M, Kim DK. Paraquat induces apoptosis through a mitochondria-dependent pathway in RAW264.7 cells. Biomol Ther (Seoul) 2015;23(5):407–13. doi: 10.4062/biomolther.2015.075. [DOI] [PMC free article] [PubMed] [Google Scholar]
- 43.Wang X, Luo F, Zhao H. Paraquat-induced reactive oxygen species inhibit neutrophil apoptosis via a p38 MAPK/NF-kappaB-IL-6/TNF-alpha positive-feedback circuit. PLoS One. 2014;9(4):e93837. doi: 10.1371/journal.pone.0093837. [DOI] [PMC free article] [PubMed] [Google Scholar]
- 44.Rowe LA, Degtyareva N, Doetsch PW. DNA damage-induced reactive oxygen species (ROS) stress response in Saccharomyces cerevisiae. Free Radic Biol Med. 2008;45(8):1167–77. doi: 10.1016/j.freeradbiomed.2008.07.018. [DOI] [PMC free article] [PubMed] [Google Scholar]
- 45.Bjorge MD, Hildrestrand GA, Scheffler K, Suganthan R, Rolseth V, Kusnierczyk A, Rowe AD, Vagbo CB, Vetlesen S, Eide L, Slupphaug G, Nakabeppu Y, Bredy TW, Klungland A, Bjoras M. Synergistic Actions of Ogg1 and Mutyh DNA Glycosylases Modulate Anxiety-like Behavior in Mice. Cell Rep. 2015;13(12):2671–8. doi: 10.1016/j.celrep.2015.12.001. [DOI] [PubMed] [Google Scholar]
- 46.Russo MT, De Luca G, Degan P, Parlanti E, Dogliotti E, Barnes DE, Lindahl T, Yang H, Miller JH, Bignami M. Accumulation of the oxidative base lesion 8-hydroxyguanine in DNA of tumor-prone mice defective in both the Myh and Ogg1 DNA glycosylases. Cancer Res. 2004;64(13):4411–4. doi: 10.1158/0008-5472.CAN-04-0355. [DOI] [PubMed] [Google Scholar]
- 47.Ortiz MS, Forti KM, Suarez Martinez EB, Munoz LG, Husain K, Muniz WH. Effects of antioxidant N-acetylcysteine against paraquat-induced oxidative stress in vital tissues of mice. Int J Sci Basic Appl Res. 2016;26(1):26–46. [PMC free article] [PubMed] [Google Scholar]
- 48.Hu JJ, Dubin N, Kurland D, Ma BL, Roush GC. The effects of hydrogen peroxide on DNA repair activities. Mutat Res. 1995;336(2):193–201. doi: 10.1016/0921-8777(94)00054-a. [DOI] [PubMed] [Google Scholar]
- 49.Chawanthayatham S, Valentine CC, 3rd, Fedeles BI, Fox EJ, Loeb LA, Levine SS, Slocum SL, Wogan GN, Croy RG, Essigmann JM. Mutational spectra of aflatoxin B1 in vivo establish biomarkers of exposure for human hepatocellular carcinoma. Proc Natl Acad Sci U S A. 2017;114(15):E3101–e3109. doi: 10.1073/pnas.1700759114. [DOI] [PMC free article] [PubMed] [Google Scholar]
- 50.Blanco-Ayala T, Anderica-Romero AC, Pedraza-Chaverri J. New insights into antioxidant strategies against paraquat toxicity. Free Radic Res. 2014;48(6):623–40. doi: 10.3109/10715762.2014.899694. [DOI] [PubMed] [Google Scholar]
- 51.Podder B, Kim YS, Zerin T, Song HY. Antioxidant effect of silymarin on paraquat-induced human lung adenocarcinoma A549 cell line. Food Chem Toxicol. 2012;50(9):3206–14. doi: 10.1016/j.fct.2012.06.007. [DOI] [PubMed] [Google Scholar]
Associated Data
This section collects any data citations, data availability statements, or supplementary materials included in this article.


