
Figure 7.
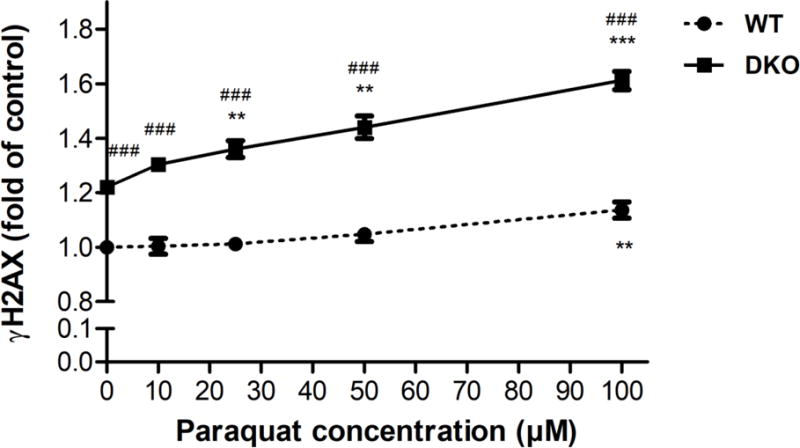
PQ induced DSBs in both AS52 WT and DKO cells. Cells were treated with PQ (10, 25, 50, and 100 μM) for 24 h and the relative levels of DSBs estimated by measuring the levels of γH2AX relative to untreated WT cells. The results are presented as mean ± SEM, N = 3. **p < 0.01, ***p < 0.001 compared with the control (untreated group). ###p < 0.001 WT compared with DKO cells.