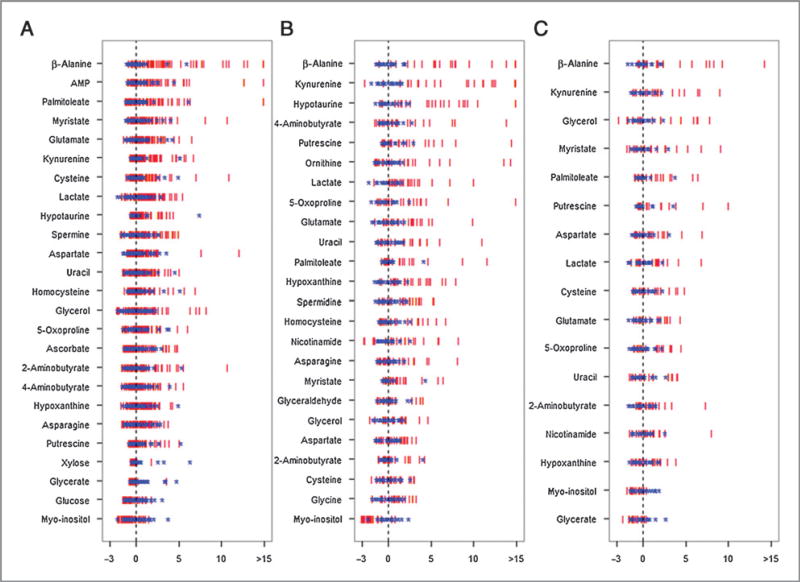
Figure 2.
The Z-score plot of differentially expressed metabolites in CRC tissues relative to adjacent nontumor tissues in the validation samples. The values were standardized using the mean values and the SDs of adjacent nontumor tissues in each group. Each vertical line represents one metabolite in one sample, colored by tissue type (blue star, nontumor tissue; red vertical line, CRC tissue). For clarity, Z-score values were cut at 15 SDs. A, samples from Hangzhou; B, samples from Beijing; and C, samples from City of Hope. AMP, adenosine-5′-monophosphate; MHB, 3-methyl-3-hydroxybutanoic acid.

