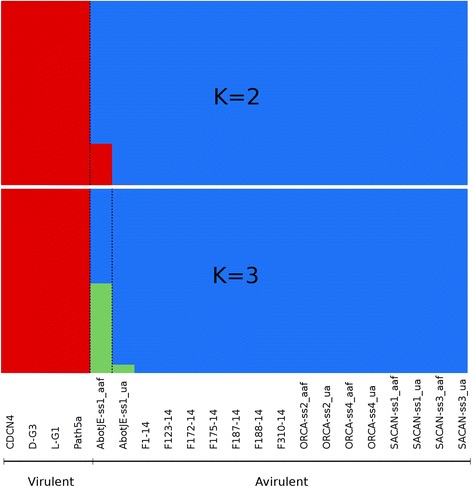
Fig. 1.

Population structure of Plasmodiophora brassicae. Population structure at K = 2 and K = 3 based on 7576 SNP markers. Each sample is represented by a single vertical bar and is partitioned into K coloured segments with lengths proportional to the estimated probability of membership in each of the inferred K clusters
