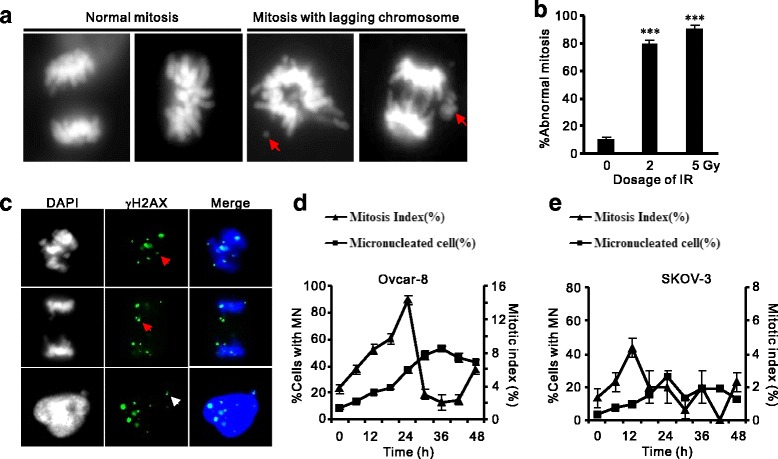
Fig. 2.

IR-induced micronuclei in OVCAR-8 cells are associated with aberrant mitosis. a-b: Representative images (a) and quantification (b) of abnormal mitoses in post-IR OVCAR-8 cells. Normal and aberrant mitosis were visualized by DAPI. Red arrows: lagging or broken chromosomes. n = 3 biological repeats. Error bars = s.d. ***P < 0.001 (t-test). c: Localization of γH2AX associated with broken chromosomes of mitotic cells (red arrows) or MN aside post-mitotic nucleus (white arrows). d-e: Enumeration of MN formation (Left vertical axis) and mitotic index (Right vertical axis) and in OVCAR-8 (d) and SKOV-3 (e) cells at 12 intervals after IR treatment (2 Gy). Both cell lines showed increased post-IR MN formation correlated with earlier changes mitotic index
