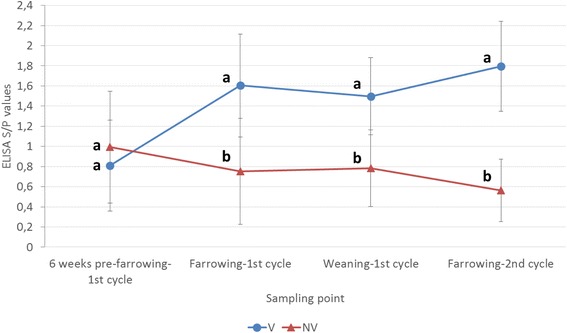
Fig. 2.

PCV2 ELISA S/P results (mean ± SD) in serum samples taken from the sows included in the study during the first (6 weeks pre-farrowing, farrowing, weaning) and second (farrowing) reproductive cycle. Different letters in superscript mean statistically significant differences (p < 0.05) among experimental groups at each sampling point
