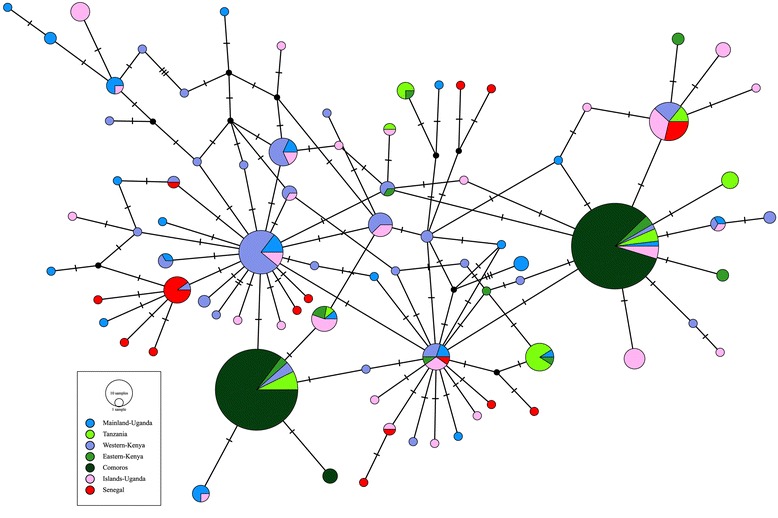
Fig. 4.

Mitochondrial DNA nad5 haplotype TCS network based on the 2015 sample from this study and additional nad5 sequences sampled from previous studies in Senegal, Kenya, Tanzania, and the Comoros [20, 37, 56] downloaded from GenBank. Each observed haplotype is indicated by a filled circle, sized according to its frequency and colored according to the location(s) where it was sampled. Inferred (unobserved) haplotypes are indicated by small black circles. Haplotype relationships are indicated by lines; mutational steps between haplotypes are represented by the number of hatches
