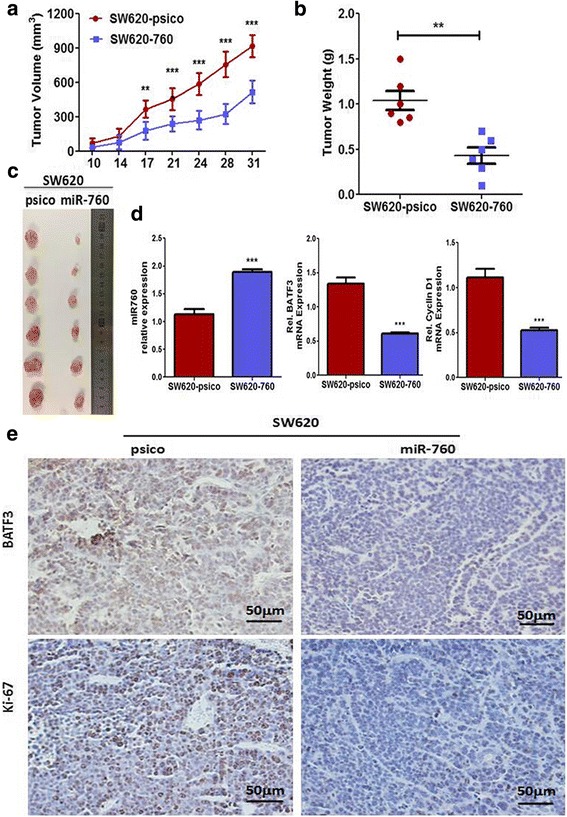
Fig. 6.

Ectopic expression of miR-760 suppressed tumor growth in vivo. The volumes (a) and weights (b) of the tumors grown in the xenograft mouse model. Data are presented as mean ± SD (n = 6). c Photographs of the dissected tumors from miR-760-overexpressed group and control group. d Expression of miR-760, BATF3 and cyclin D1 mRNA in tumors. e Immunohistochemistry of tumor tissues in SW620-psico and SW620-760 group. Assays were performed in triplicates. Mean ± SD is shown. Statistical analysis was conducted using Student’s t test. **P < 0.01, ***P < 0.001
