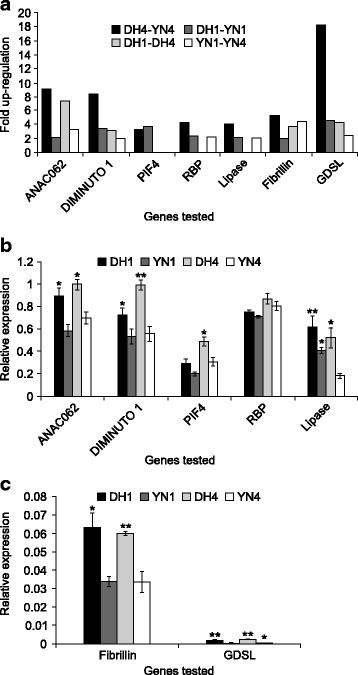
Fig. 3.

Relative expression pattern of seven regulatory and biochemical genes in stem sections DH12075 (DH) and YN01–429 (YN) using qRT-PCR. a Each value is the mean ± SD from 2 biological replicates each technically replicated 3 times. b and c. Each value is the mean ± SD from 3 biological replicates, each technically replicated 3 times. 1, stem section 1. 4, stem section 4. Values with asterisks represent significantly different data of DH relative to YN where * p ≤ 0.05 and ** p ≥ 0.01. The significance test was done separately for each gene
