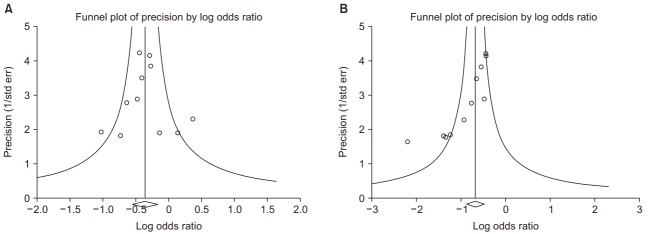
Fig. 5.
Funnel plot showing the effect size on the x-axis and sample size on the y-axis as a scatter plot. (A) Funnel plot without publication bias. The individual plots are broader at the bottom and narrower at the top. (B) Funnel plot with publication bias. The individual plots are located asymmetrically.

