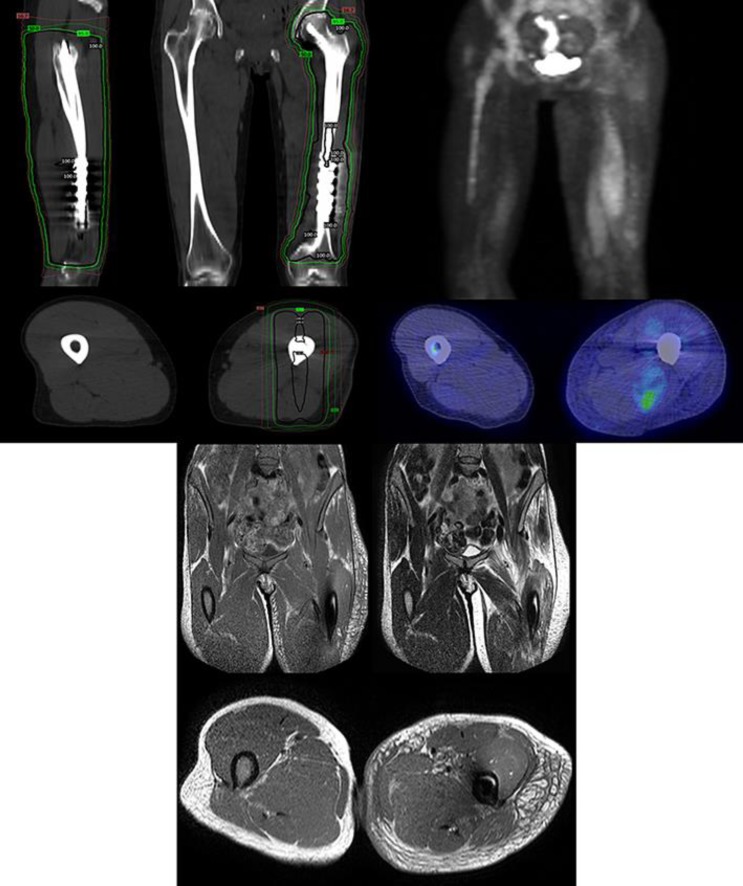
Fig. 2.
Top left: radiation fields of the left femur, with sagittal (top left), coronal (top right), and axial (bottom) views. The isodose levels shown are 16.7, 50, 95, and 100%. Top right: PET/CT showing edema and increased FDG uptake of the left thigh, consistent with myositis, with front-facing 3D (top) and axial (bottom) views. Bottom: MRI showing edema of the left thigh, consistent with myositis, with T1-weighted coronal images (top left), T2-weighted coronal images (top right), and T1-weighted axial images (bottom).

