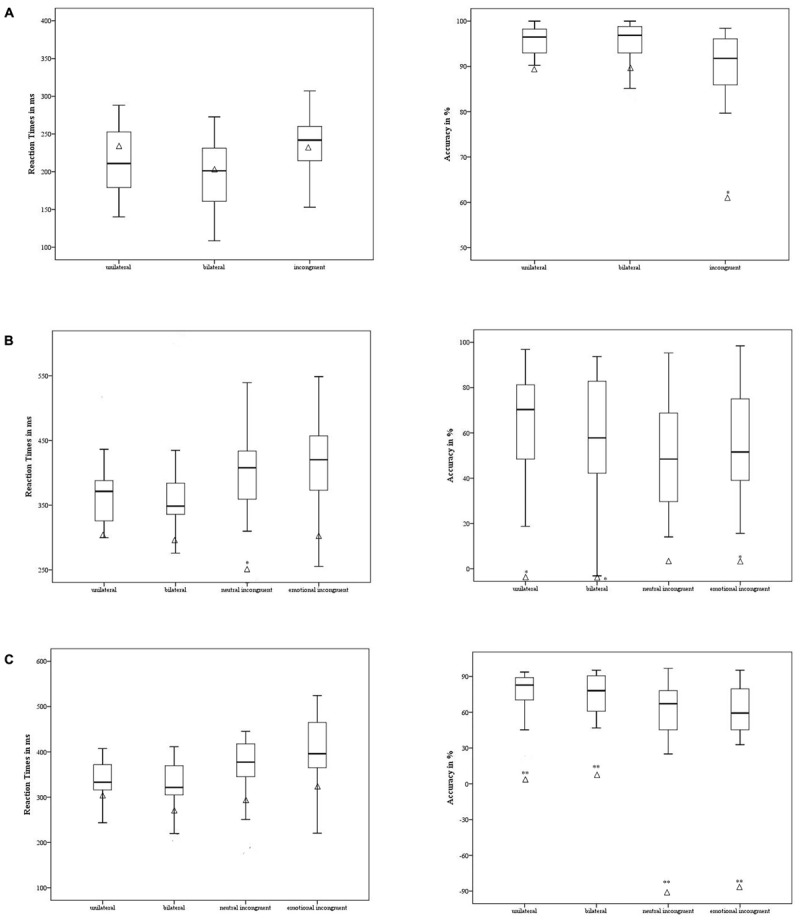
FIGURE 4.

Case #2’s behavioral performance in the non-emotional task (A), emotional task – anger (B), and emotional task – fear (C) was contrasted with the control group. The means of accuracy (right side) and RT (left side) are reported for case #2 (in triangle) and the control group (the minimum, the lower quartile, the median, the upper quartile, and the maximum are shown). ∗p < 0.05; ∗∗p < 0.001.
