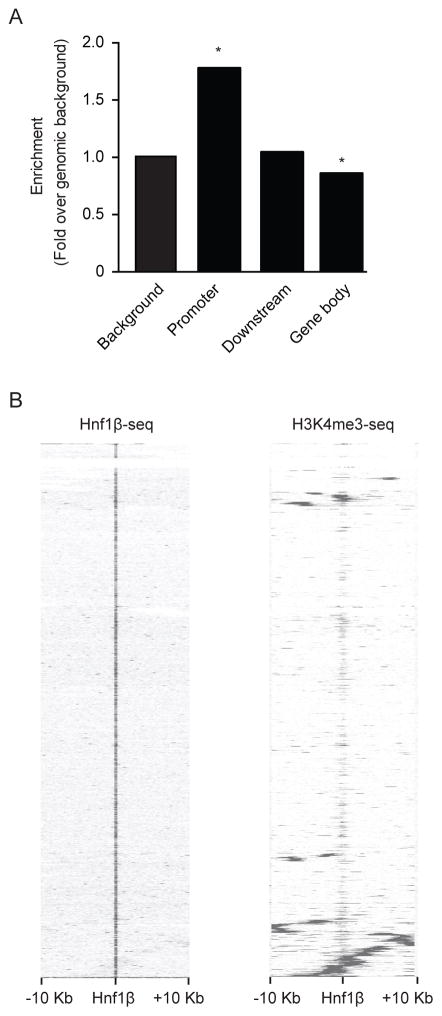
Figure 3. HNF1β peaks are significantly enriched in putative promoter regions.
a) Distribution of HNF1β peak location relative to RefSeq genes. Promoter indicates all HNF1β peaks that are <3 kb upstream from the TSS. Downstream refers to enrichment of HNF1β peaks over genomic background in <3 kb downstream from the TSS. A significantly lower enrichment of HNF1β peaks over genomic background is shown in the gene body. The gene body includes all exons, introns, 5′ UTR and 3′ UTR. One-sided binominal test *, p<0.01. b) Heatmap of HNF1β and H3K4me3 chIP-seq signal in a 10 kb window around HNF1β peak regions using hierarchical clustering with Euclidean distance metric. Rows in the heatmap represent individual peak regions. Left, all HNF1β peaks are centered in the middle of the map. Most HNF1β peaks are located >10 kb upstream or distal locations from H3K4me3 positive promoters.

