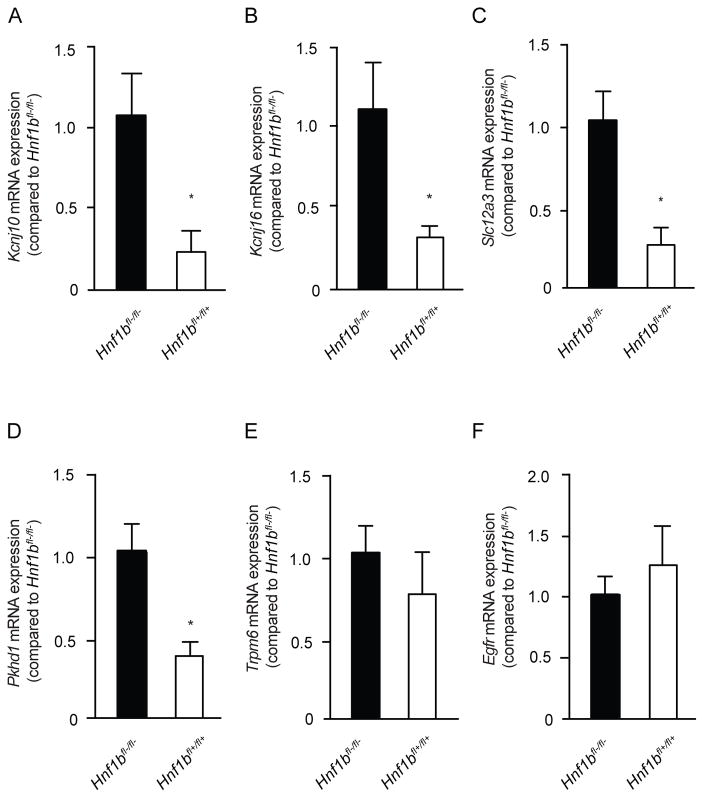
Figure 6. Kcnj16, Kcnj10 and Slc12a3 transcripts are reduced in a HNF1β mutant mouse model.
a–f) The mRNA expression levels of Hnf1β (A), Kcnj16 (B), Kcnj10 (C), Egfr (D), Fxyd2a (E), Fxyd2b (F) in Ksp-Cre;Hnf1βflox/flox mouse kidneys. The black bars represent Hnf1βfl-/fl- wild-type mice, while the white bars represent Hnf1βfl+/fl+ knockout mice. Samples were measured by quantitative RT-PCR and normalized for 18s ribosomal RNA expression. Data (n=3) represent mean ± SEM and are expressed as the fold difference when compared to the expression in Hnf1βfl-/fl- wild-type mice.

