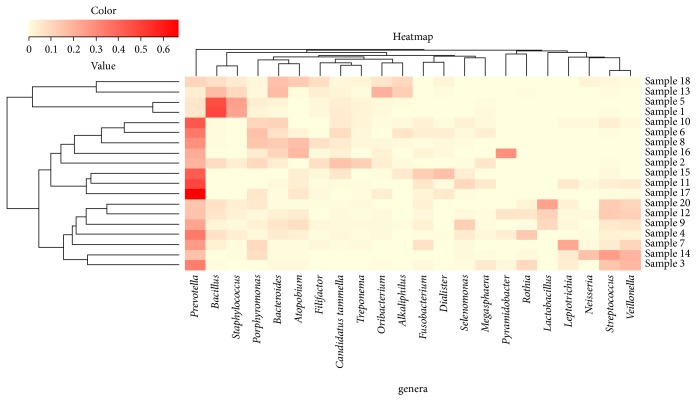
Figure 5.
Heatmap with dendrogram at the genus level using a gradient heatmap (over 1% of the microbiome). The 22 most abundant genera were used in hierarchical clustering to evaluate the relationships between 19 samples using weighted pair clustering based on Barry-Curtis measurements. The darker the red color was the more predominant the genus was.

